Download
1 / 57
570 likes | 707 Views
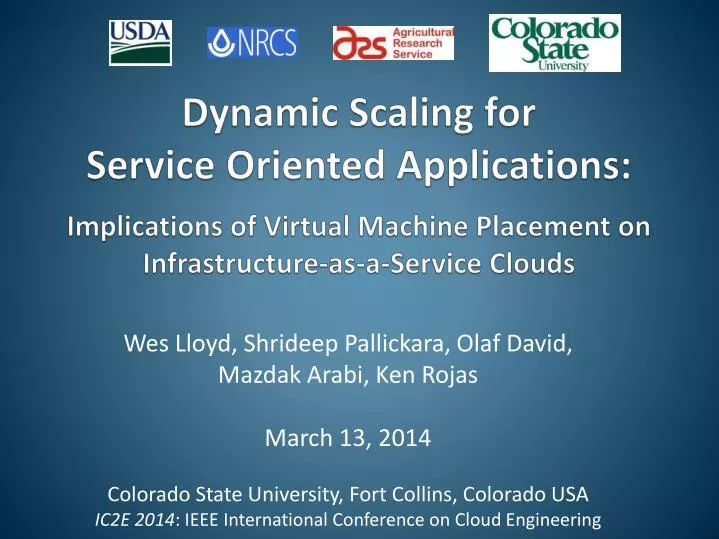
Dynamic Scaling for Service Oriented Applications: Implications of Virtual Machine Placement on Infrastructure-as-a-Service Clouds. Wes Lloyd, Shrideep Pallickara , Olaf David, Mazdak Arabi , Ken Rojas March 13 , 2014 Colorado State University, Fort Collins, Colorado USA

E N D
Dynamic Scaling for Service Oriented Applications:Implications of Virtual Machine Placement on Infrastructure-as-a-Service Clouds Wes Lloyd, ShrideepPallickara, Olaf David, MazdakArabi, Ken Rojas March 13, 2014 Colorado State University, Fort Collins, Colorado USA IC2E 2014: IEEE International Conference on Cloud Engineering
Outline Background Research Problem Research Questions Experimental Setup Experimental Results Conclusions
Dynamic Scaling forService Oriented Applications Hot Spot Detection VM Launch Latency Future Load Prediction Pre-provisioning WHERE WHAT WHEN
Dynamic Scaling forService Oriented Applications Size Vertical Scaling Quantity Horizontal Scaling Load Balancing VM VM VM VM VM WHAT VM VM VM VM VM VM VM VM VM VM VM VM
Dynamic Scaling forService Oriented Applications Physical Host VM VM VM Physical Host VM VM VM VM VM Scheduling VM VM WHERE Physical Host VM VM VM VM VM VM VM Physical Host VM VM VM VM Launch Requests
IaaS Cloud: VM Placement Physical Host Physical Host Physical Host VM VM VM VM VM VM • In practice there are two predominant VM placement schemes • Greedy – fill first: consolidate • Round-robin – spread first: load balance • Commonly provided by • Eucalyptus, OpenStack, OpenNebula, Apache CloudStack • What are the performance implications for dynamic scaling? • For SOAs, are they sufficient?
Research Questions RQ1: RQ2: What performance implications result from VM placement location when dynamically scaling service oriented applications? How important is VM placement for scaling in response to increasing service demand? How do resource costs (# of VMs) vary when dynamically scaling service oriented applications as a result of VM placement location?
ModelingServices ~6 million shapes 340k XML files POSTGRESQL OMS3 RUSLE2/ WEPS POSTGIS • USDA-NRCS - Soil erosion models • RUSLE2: soil loss from rainfall and runoff • WEPS: soil loss from wind
VM-Scaler Least-Busy VM Scheduler future Infrastructure Mgmt Requests Application Service Request Physical Host Physical Host Physical Host Physical Host Physical Host Physical Host VM VM VM VM VM VM VM VM VM VM VM VM VM VM VM VM Proxy Services Cloud Mgmt Services VM-Scaler Physical Host Physical Host Physical Host Physical Host Physical Host Physical Host VM VM VM VM VM VM VM VM VM VM VM VM Elastic Compute Cloud API
Least-Busy VM Placement CPU - Total CPU time weighted 2X • RU-sensors collect Virtual/Physical machine data @ 15s/intervals • Busy-Metric used to calculate aggregate load at each physical machine • Flexible metric design • Objective not to design perfect metric / VM scheduler Resource Utilization Data Disk - Disk sector reads (DSR) - Disk sector writes (DSW) Network - Network bytes sent (NBR) - Network bytes received (NBS) Virtualization - Total VM count per host
Dynamic Scaling Tests ▪ Initial load before scaling ▪ Simulates multi-tenant cloud environments Rusle2: 7,000 runs/test WEPS: 300 runs/test Shared cluster load simulation Modeling workloads
Application Performance Improvement vs. Round-Robin VM Placement Average Performance Improvement: ~16.1% RUSLE2 ~11.6% WEPS_ ~14% aggregate Normalized % Performance Improvement Statistical significance
Resource Cost Savingsvs. Round-Robin VM Placement Average Savings: ~2.7% fewer VMs ~14.7 fewer CPU cores Resource Cost Savings % Fewer VMs
Conclusions RQ1: RQ2: Abstraction of physical hardware using IaaS clouds leads to the simplistic view: (1) Resources are homogeneous (2) Scaling infinitely provides linear performance increases Our results demonstrate: (1) The importance of fine grained resource management for supporting infrastructure elasticity (2) Where hardware is not infinite Least-Busy VM placement enabled performance improvements up to: 29% (RUSLE2), 19% (WEPS) ▪ When dynamically scaling ▪ In the presence of a shared load These performance improvements were realized using slightly fewer (2.7 %) virtual machines.
Gaps in Related Work • Prior work investigates: • WHEN to scale – hot spot detection • WHAT to scale – size and number of VMs • WHERE to scale • Task/job scheduling • VM placement/migration across nodes • No studies have investigated implications of VM placement for dynamic scaling application infrastructure…
LeastBusy VM Placement • LeastBusy VM placement • “Busy Metric” rates resource utilization of physical hosts and virtual machines • Resource • Identifies • Parallel launch: launch N VMs per scaling event • Double-schedule MAX BusyMetric threshold • Only if min distance (BusyMetric) to nearest neighbor
Eucalyptus 3 Private Cloud • (9) Sun X6270 blade servers • Dual Intel Xeon 4-core 2.8 GHz CPUs • 24 GB ram, 146 GB 15k rpm HDDs • CentOS 5.6 x86_64 (host OS) • Ubuntu 9.10 x86_64 (guest OS) • Eucalytpus 3.1 • Amazon EC2 API support • 8 Nodes (NC), 1 Cloud Controller (CLC, CC, SC) • Managed mode networking with private VLANs • XEN hypervisor v 4.1, paravirtualization
SC1 SC2 SC3 SC4 M D F L M D F L M D F L M D F L SC5 SC6 SC7 M D F M D F L M D F L L • (15) Tested Component Deployments • Each VM deployed to separate physical machines • All components installed on composite image • Script enabled/disabled components to achieve configs SC8 SC9 SC10 M D F L M D L F M F D L SC11 SC12 SC13 M F D L M L D F M L D F SC14 SC15 M D L F M L F D
Tested Resource Utilization Variables • CPU • CPU time Disk - Disk sector reads (dsr) - Disk sector reads completed (dsreads) Network - Network bytes sent (nbr) - Network bytes received (nbs) c
Amazon Web Services: White Paper on Application Deployment • Amazon white paper suggests: “bundling the logical construct of a component into an Amazon Machine Image so that it can be deployed more often.” J. Varia, Architecting for the Cloud: Best Practices, Amazon Web Services White Paper, 2010, https://jineshvaria.s3.amazonaws.com/public/ cloudbestpractices-jvaria.pdf • To support application scaling
Service Isolation Advantages • Enables • Horizontal scaling • Fault tolerance MongoDB MongoDB MongoDB MongoDB MongoDB MongoDB tomcat7 nginx PostgreSQL MemcacheDB MySQL MongoDB SCALE
Service Isolation Overhead tomcat7 nginx PostgreSQL • Isolation requires • Separate operating system instances • More network traffic
Provisioning Variation Request(s) to launch VMs VMs Share PM CPU / Disk / Network VM Physical Host Physical Host Physical Host VM VM VM VM VM VM Ambiguous Mapping VM VM VM VM VM Physical Host Physical Host Physical Host VM VM VM VM VM VM VMs Reserve PM Memory Blocks PERFORMANCE
Infrastructure Management Service Requests • Scale Services • Tune Application Parameters • Tune Virtualization Parameters Application Servers Load Balancer Load Balancer distributed cache noSQL data stores rDBMS
Application Deployment Challenges • VM image composition • Service isolation vs. scalability • Resource contention among components • Provisioning variation • Across physical hardware
Experimental Data • Script captured resource utilization stats • Virtual machines • Physical Machines • Training data: first complete run • 20 different ensembles of 100 model runs • 15 component configurations • 30,000 model runs • Test data: second complete run • 30,000 model runs
Application Deployments n=# components; k=# components per set Permutations Combinations But neither describes partitions of a set!
Bell’s Number Number of ways a set of n elements can be partitioned into non-empty subsets config 1 n = #components VM deployments M D config 2 F L Model M D F 1 VM : 1..n components Database L Component Deployment File Server config n Log Server D M L Application “Stack” F . . . k= #configs # of Configurations
Service Configuration Testing • Big VMs • All application services installed on single VM • Scripts enable/disable services to achieve configurations for testing • Each VM deployed on separate host • Provisioning Variation (PV) Testing • KVM used • 15 total service configurations • 46 possible deployments
Service Configuration Testing - 2 • Big VMs used in physical isolation were effective at identifying fastest service configurations • Fastest configurations isolate “L” service on separate physical host; and VMs • Some provisioning variations faster • Other SC provisioning variations remained slow • SC4A-D, SC9C-D • Only SCs w/ avg ensemble performance < 30 seconds