Download
1 / 36
370 likes | 496 Views
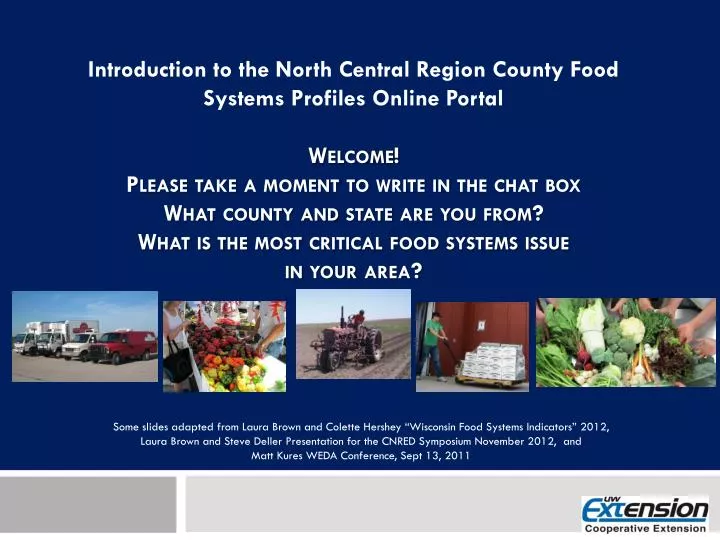
Introduction to the North Central Region County Food Systems Profiles Online Portal Welcome! Please take a moment to write in the chat box What county and state are you from? What is the most critical food systems issue in your area?.

E N D
Introduction to the North Central Region County Food Systems Profiles Online Portal Welcome! Please take a moment to write in the chat box What county and state are you from? What is the most critical food systems issue in your area? Some slides adapted from Laura Brown and Colette Hershey “Wisconsin Food Systems Indicators” 2012, Laura Brown and Steve Deller Presentation for the CNRED Symposium November 2012, andMatt Kures WEDA Conference, Sept 13, 2011
Introduction to the North Central Region County Food Systems Profiles Online Portal Laura Brown Center for Community Economic Development University of Wisconsin – Extension, Cooperative Extension Anna Haines Center for Land Use Education University of Wisconsin – Stevens Point February 11, 2013 (Monday) 1:00 PM – Eastern Time http://connect.msu.edu/ncrcrd
Introduction to the North Central Region County Food Systems Profiles Online Portal • Project background and implementation • Using and referencing secondary data sources • A tour through the portal, county profiles maps, discussion guide, and resources • Uses and next steps
UW- Extension Colleague Survey- 2011 • Identify food systems programming occurring in Wisconsin • Identify common curriculum or other resource needs. • 282 responses, (70 state specialists and 208 educators) All 72 counties represented. Response rate 24% • Resource Needs (open ended responses) • Specialist support- fact sheets, research base, data, evaluation, age appropriate materials, professional development • Systematic coordinated approach(program leadership support) • Opportunities for sharing information/networking and communication • Financial support • Information on business and economic development, entrepreneurship (materials for youth audiences) • Staff and staff time dedicated to this work • Food safety information
Community Food Systems Team Currently 129 members on the Community Food System Team which cuts across all four of the Program Areas
Our educational programming must be based on a solid scholarly foundation… • Creative, intellectual work • Reviewed by the scholar’s peers who affirm its value • Added to our intellectual history through its communication • Valued by those for whom it was intended
Why a comprehensive data portal? • no existing comprehensive data tool to support holistic planning around food systems • data for community planning • baseline data for evaluation • opportunity to bridge a research focused effort and Extension programming – i.e. documenting links between local foods & rural economic growth
Intended Outcomes and/or Research Objectives • Develop and publish an online food systems profile tool using existing secondary data sources: • Help county educators and community leaders understand local/regional food systems in a systematic way • Understand how key indicators are changing over time. • Identify opportunities for growth or expansion in regional food systems through the use of food and agricultural industry cluster analysis.
Center for Community & Economic Development- Laura Brown UW-Madison Department of Agriculture & Applied Economics – Steve DellerCenter for Land Use Education - Anna HainesApplied Population Laboratory- Dan Veroff and Jim BeaudoinUW Publications- Abby Thunker • Food Systems Profiles Project PartnersUniversity of Wisconsin-Extension County PartnersPilot counties Advisory CommitteeIllinois: Margaret Larsen, DebroahCavanaugh Grant, Kathie Brown, Wisconsin: Dan Veroff, Colette Hershey, Judi Bartlett, Carrie Edgar, Steve Deller, Anna Haines, Laura Paine, Michelle Miller Iowa: Nadia Andersen, Teresa WeimerslageMichigan: Katherine HaleOhio: Brian Raison, Minnesota: Greg Schweser, Kathie DraegerNebraska: Elaine Cranford
Before we measure anything.. • Define the question • Learn as much as you can about it • Identify goals and challenges • What questions will others have about this? • What information do we need to answer the question? • Who will use this information? How will they use it? When is it needed? How will we do it? • Explore the data • What is the story is the data telling us? • Create ways to understand the data “Planning and Program Evaluation Worksheet.” University of Wisconsin-Extension • Cooperative Extension • Program Development & Evaluation UW-Extension http://www.uwex.edu/ces/pdande
Data are the Ingredients – Effective Use Requires Transformation to Information, Presentation and Knowledge (c) 2011 Epic. graphic
Using Economic and Demographic Data Uses: • Stimulate discussion; • Affirm or challenge current perceptions; • Identify local strengths and weaknesses; • Recognize and prepare for change. Considerations: • Looking for patterns, not a single answer; • More concerned with trends than precision; • Focus more attention on comparing figures rather than ranking them.
http://www.ers.usda.gov/data-products/food-environment-atlas/go-to-the-atlas.aspx/http://www.ers.usda.gov/data-products/food-environment-atlas/go-to-the-atlas.aspx/
http://www.ers.usda.gov/data-products/food-environment-atlas/go-to-the-atlas.aspx/http://www.ers.usda.gov/data-products/food-environment-atlas/go-to-the-atlas.aspx/
Profile Indicators • Chosen based on discussions with advisory committee, data available at the county level • Food Access • Food Assistance • Health • Local and Direct Markets • Processing and Distribution • Production Agriculture
Maps http://www.foodsystems.wisc.edu/
In addition to the factsheet for each county in the North Central region, a set of maps, one for each indicator, is also provided. The idea is to help think about “clusters”. Hot spot analysis
In addition to the factsheet for each county in the North Central region, a set of maps, one for each indicator, is also provided. The idea is to help think about “clusters”.
..and provide a way of starting to think through connections between various aspects of the food system. Public health and agricultural production?
Discussion Guide • What does this data say about your county’s: Food Access?Food Assistance? • Health?Local and Direct Markets? Processing and Distribution? Production Agriculture? • What surprised you about your profile? • Are there relationships between indicators in your profile? • How is your county similar or different from the region? • What has changed over time in your county? What has stayed the same? • What areas of the food system are most developed in your county? Why? • What don’t you know about you food system based on this profile? How might you find this information? • What groups, organizations, programs, or departments support the aspects of your food system that are developed or underdeveloped? • Who should be involved in the food system that isn’t already? • How will you use this information? Who else might use it?
Resources http://www.foodsystems.wisc.edu/
Definitions/Sources http://www.foodsystems.wisc.edu/
Agricultural Production &Public Health & NutritionPoints of Inquiry • Are there connections between farm labor and poverty issues including living wage? • Are there connections between race,ethnicity of farm labor & poverty issues? • Can direct market consumption meet our nutritional needs? What are implications for agricultural production? • What are the environmental health implications of agricultural production (water quality, air quality, natural resources) • What role does Wisconsin’s commodity production play in the health of Wisconsin residents (use of commodity crops in production of processed goods?) • Where are there policies in conflict between these areas? (local , state federal) Where are they aligned?
Best Practices- • What we’ve learned so far • Review data before sharing with partners • Put the tool in context using maps, discussions • Consider your audience • Consider starting with two specific indicators i.e. “Are there connections between agricultural production and health issues?”
Limitations - Next steps • Limited to available secondary data • Not comprehensive • No intermediated sales or processing/distribution • Easier to make connections with images versus tables. Consider infographs? • Defining local foods – a challenge • MUST be supplemented with local wisdom AND more research • How do we begin to evaluate the impacts of local food systems work? (economic, social, health, etc)
How might you use this tool? How could it be more useful?
Anna Haines Center for Land Use Education University of Wisconsin – Stevens Point Laura Brown Community Development Specialist Center for Community Economic Development University of Wisconsin-Extension, Cooperative Extension Thank you!