Download
1 / 27
280 likes | 388 Views
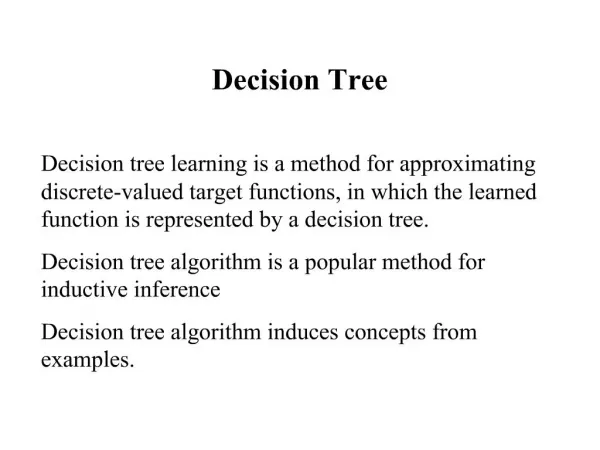
DECISION TREE. Developed for the National Petroleum Technology Office By Brian Keltch & Andrew Hastings bkeltch@npto.doe.gov (918) 699-2065 TRW. Presented By Len Volk. What Is It?. Computer program Aids making decisions & risks in these decisions Organizes available information

E N D
DECISION TREE Developed for the National Petroleum Technology Office By Brian Keltch & Andrew Hastings bkeltch@npto.doe.gov (918) 699-2065 TRW Presented By Len Volk
What Is It? • Computer program • Aids making decisions & risks in these decisions • Organizes available information • Highlights missing data • Provides “big picture” • Applicable to any process or project
Outline • Demonstrate program using a simple example • Apply decision tree concept to: • Hydraulic stimulation of oil & gas wells • Evaluating a sand deposit • Future enhancements
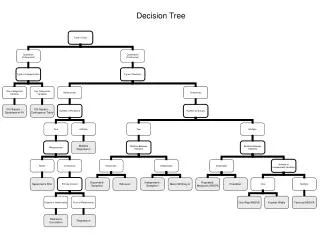
Choice Node: Alternatives or choices – Name Chance Node: Multiple uncertainties – Name & Probability Value Node: The terminal node - Value
Fracture Cross Section Shale Shale
Typical InformationAvailable About a Well • Reservoir depth • Bottom hole temperature • Fluid type (oil, water, gas) • Production history • Initial logs (pay thickness, porosity, bounding zones) • Initial well test (Po, k) • Reservoir rock characteristics (SS, LS, clay)
Fracturing-1 Workover IOR Service Co. Horiz Well Propellant Consultant Fracture Hydraulic Internal H2O Flood Explosive Me New Well Nothing Cycle 1 Cycle 2 Cycle 3
Fracturing-2 Service Co. Consultant No CBL W Test: p, s Internal Run CBL No W Test Me Cycle 3 Cycle 4 Cycle 5
Data for CBL CBL cost Remediation cost Frac job cost Current production Oil price Post frac production Production loss if bad CB No. day/yr production $5000 $15,000 $100,000 10 Bbl/day $30/Bbl 30 Bbl/day 2 Bbl/day 200 day 5yr revenue increase with frac: $600,000 5yr loss in revenue if CB bad: $60,000
Cement Bond Log $495,000 CB OK P=90% [$445,000] CBL OK $-165,000 CB bad P=10% [$-16,500] Run CBL Cost: $5000 $480,000 CB fixed P=80% [$384,000] CBL bad, fix Cost: $15,000 $-180,000 CB bad P=20% [$-36,000] $500,000 CB OK P=60% [$300,000] No CBL $-160,000 CB bad P=40% [$-64,000]
Fracturing-3 Cycle 5 Cycle 6 Cycle 7 No CBL Stress Test Re-Perf Run CBL No Test No Perfs Tubing Core Test:Cw Pr Test Casing FO Test: Cw No Pr Test Annulus Estimate Cw Cycle 8 Cycle 9 Cycle 10
Fracturing-4 >2000’ MS Sand Tubing HS Sand 1000-2000’ Casing RC Sand 250-1000’ Annulus <250’ ISP HSP Cycle 10 Cycle 11 Cycle 12
Fracturing-5 HC Fluid 8/16 Mesh WB Fluid MS Sand 12/20 Mesh Emulsion HS Sand 16/30 Mesh Foam RC Sand 20/40 Mesh ISP 40/70 Mesh HSP Cycle 12 Cycle 13 Cycle 14
Fracturing-6 Guar X-Linker HPG HC Fluid No X-Linker CMHPG WB Fluid HEC Emulsion Water Foam Cycle 14 Cycle 15 Cycle 16
Fracturing-7 Zirconate None X-Linked Borate Oxidant Titanate No X-L Enzyme Cycle 16 Cycle 17 Cycle 18
Fracturing-8 Silica Flour None Encapsulated 100 Mesh Sand Oxidant No Oil-Sol Resin Enzyme Ca Carbonate None Cycle 18 Cycle 19 Cycle 20
Fracturing-9 Silica Flour 100 Mesh Sand KCl Oil-Sol Resin Clay Stab 1 Ca Carbonate 5% Diesel Clay Stab 2 None 3% Diesel None No HC Cycle 20 Cycle 21 Cycle 22
Fracturing-10 50% Pad 50-100Bbl/m KCl 25% Pad 25-50Bbl/m Clay Stab 1 10% Pad 15-25Bbl/m Clay Stab 2 None Cycle 22 Cycle 23 Cycle 24
Fracturing-11 50-100Bbl/m Indep Serv Co Shut-In 25-50Bbl/m Major Serv Co Flow Back 10-25Bbl/m Small Serv Co Cycle 24 Cycle 25 Cycle 26
Development of a Sand Deposit Do B Do D Do A Do C No No No No Do A Short cut notation Do B Do C Do D
Sand Deposit-1 Survey Existing Data Satellite Aerial Surface Maps Excavations Wells
Sand Deposit-2 1000’ Sample Collection 200’ 500’ Factorial 60’ Spatial 100’ Depth Pattern 30’ 20’ 10’ Core Back Hoe
Sand Deposit-3 Evaluating Potential Products Sieve Anal Glass Sand Mineral Mineral Anal Blast Sand Elemental Mineral Sol. Frac Sand Asphalt Crush Res. Aggregate Cement Round&Sphere Water Pack Rd Base Pt, Rh Pr Minerals Fire Assay Au, Pd Re, Os Aqua Regia
Sand Deposit-4 Frac Sand Development Mining Overburden Disaggregation Consolidated? Transportation Equipment? Frac Sand Scrubbing Mesh Sizes? Washing Screen Size? Classification Screen Type?
Planned Enhancements • Allow Decision Tree to be placed into a Word document or PowerPoint presentation • Add ability to edit directly from screen • Several improvements in editing branches • Allow printing as Portrait or Landscape • Many others – given in Slide Notes
Len Volk International Separations Technology, Woodward, OK The University of Tulsa, Petroleum Engineering PCM Technical, Tulsa, OK Consultant, Tulsa, OK (918) 481-5948 (918) 852-6546 (cell) lenvolk@swbell.net