Download
1 / 20
250 likes | 403 Views
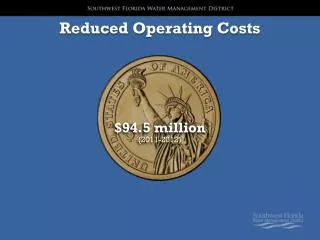
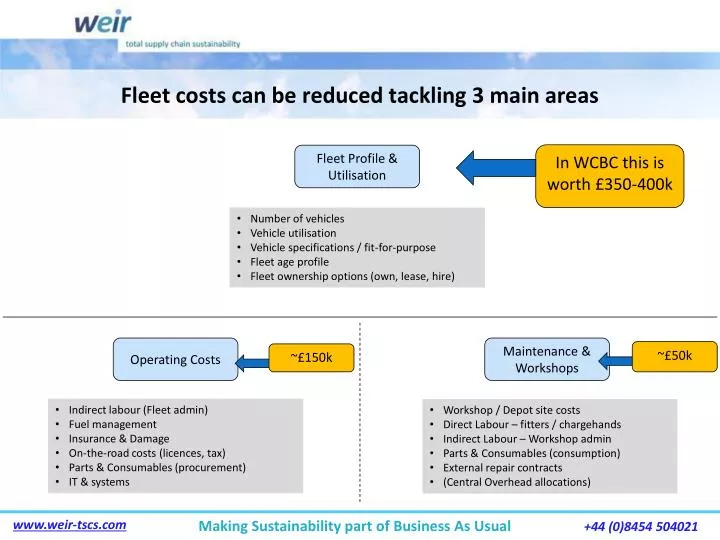
Fleet costs can be reduced tackling 3 main areas. In WCBC this is worth £350-400k. Fleet Profile & Utilisation. Number of vehicles Vehicle utilisation Vehicle specifications / fit-for-purpose Fleet age profile Fleet ownership options (own, lease, hire). Operating Costs.

E N D
Fleet costs can be reduced tackling 3 main areas In WCBC this is worth £350-400k Fleet Profile & Utilisation • Number of vehicles • Vehicle utilisation • Vehicle specifications / fit-for-purpose • Fleet age profile • Fleet ownership options (own, lease, hire) Operating Costs Maintenance & Workshops ~£50k ~£150k • Indirect labour (Fleet admin) • Fuel management • Insurance & Damage • On-the-road costs (licences, tax) • Parts & Consumables (procurement) • IT & systems • Workshop / Depot site costs • Direct Labour – fitters / chargehands • Indirect Labour – Workshop admin • Parts & Consumables (consumption) • External repair contracts • (Central Overhead allocations)
Programme Overview: £0.6m over 12-18 months Sept 2011 Dec 2011 Mar 2012 Jun 2012 VEHICLE UTILISATION £220k £100k £50k • Mobilise • Establish project team • All Services represented • Reduce Fleet Size • Eliminate vehicles • Build management info • Re-set replacement plan • Improve Utilisation • Vehicle shares • Process changes • Re-think Service delivery • Collaboration • Regional view • Specialist vehicle shares • Soft market testing OPERATING COSTS £80k £40k £30k • Driver Engagement • Fuel monitoring • Tyre Pressures • Toolbox talks • Admin & Processes • Simplify Fleet admin • Regional view? • Insurance & Damage data • Vehicle Base Locations • Home to work mileage • Stem miles/productivity • Task Management SUPPORT COSTS £30k £30k £20k • Workshop Productivity • “Spanner time” review • Plan for reducing workload • Identify spare capacity • Workshop Contracts • External income • Soft market testing • Regional view? • Parts & Tyres • Review residual spend • Tyre damage campaign • Vehicle standardisation? Note: Savings are total figures for each Programme element – for PHASING see next slide
Many of the benefits are deliverable inside 12 months • Both lines show repeatable annual savings run-rates • Note: The savings include cost-avoidancemeasures (e.g. fuel savings), and savings in Housing budget which are not directly cashable • Assumes immediate start for Transformation Programme. Blue line is conservative minimum savings projection • Benefits relate to Fleet costs only (not Service delivery team costs)
Executive Summary - Opportunity • WCBC spends £4.2m per year on its fleet of 320 vehicles: • £3.9m is attributable to specific vehicle and support costs • £0.3m is Central Overhead allocation (IT, HR, management charges & fuel on-cost charge) • On average these vehicles spend 76% (18 hours) of every weekday parked at base locations not being used • A conservative benchmark from other Council fleets would be to raise usage from 24% to 30%. Some WCBC vehicles are significantly worse than the average 24% utilisation figure. • This presents a radical opportunity to transform fleet operations, eliminate waste, reduce costs, and protect service delivery through changes in operational processes & working practices • Profile, specification & utilisation of the fleet is driven by Service (user) departments. Introduction of best practice Logistics management (ideally with a wider regional/sub-regional brief and building on existing best practice) will deliver cost reductions in: • Operational effectiveness (utilisation of vehicles, fuel management, provision of management information) • Maintenance (Workshop optimisation, damage monitoring, spares costs) • Procurement (clear replacement programme with adequate challenge on specs)
Executive Summary - Benefits • The cost reduction opportunity is significant, with potential benefits of £0.4 -0.6m over 18 months. • Note: Savings includecost avoidance (e.g. reduced fuel usage to counter future price increases) and ring-fenced savings within the Housing budgets. • We believe that the run rate of savings at the end of the first 12 months of a Fleet Transformation Programme will be £0.5m pa. This represents a major change programme, affecting all user groups. • Initial priorities include: • Establishing fuel tracking measures & investigating vehicles with high fuel usage • Creating a vehicle Utilisation tracker & challenging the need for any vehicle with utilisation levels <25% (based on “24/5” operation) • Detailed review of specific groups of vehicles with each Service area, including: • Working / shift patterns / Seasonality • Vehicle specification & ownership models • Routing & Scheduling improvements • Developing a strategy to match Workshop productivity to current/future Fleet needs • This level of cost saving has been achieved by other Local Authorities, but will require a clear Programme structure and strong sponsorship from senior Management and Council Members.
Executive Summary – Opportunities Overview • Pan-Service Fleet cost reduction programme • Management reporting improvements • Challenge/remove underutilised vehicles • Hire vehicle review process/challenge • Optimisation of internal Pool vehicles • Use Trackers effectively & analyse data • Comprehensive fuel management • Driver training & fuel efficiency monitoring • Review of spares purchasing & specs • Reduced fleet support/admin costs • Review stem mileage, vehicle basing • Reduce Home to Work mileage • Link vehicle purchases to fleet reduction • Eliminate vehicles as “toolboxes” • Review of damage by vehicle/driver • Driver vehicle care/checks/compliance • Workshop optimisation • Review In-house versus bought-in maintenance services • More effective procurement process • Challenge specifications, e.g. van size, special equipment, crew cabs… • Improve routing & tasking of mobile workforce (e.g. Streets, Highways) • Integrated courier services • Pool car tracking & usage • Gritting bodies & routing • Vehicle share within/between Services • Shift patterns / extend “active” times • Fleet Management drive review of vehicle implications of future service requirements • External contract income • Outsource / remove specific services • Review hire fleet versus Council tasking • “Cross-border” cooperation • Continuous improvement culture • Extension of Workshop hours • Non-vehicle solutions (e.g. grass cutting & growth inhibitors) • Journey elimination, meeting protocols • Establish true costs of service levels (e.g. Library vans) & range of options • Only procure a new vehicle after you’ve first tried to eliminate it… • Remove spare vehicles (service level…) • Vehicle life optimisation • Policy • Service Levels • Offering Increasing Opportunity • Process change • Integration of services • Cooperation • Trimming waste • Optimising performance • Simple Operational Change Strategic Change Organisational Improvement / Change £££ Operational Improvement Increasing Scope
WCBC spends £4.2m p.a. on fleet services • This high level breakdown of costs helps prioritise activity & size of opportunity • The majority of costs are variable with the size of the fleet, or semi-fixed (e.g. workshop labour and fuel, which are open to efficiencies but primarily driven by overall workload rather than incremental vehicle numbers) • The Management Fee includes both direct wage costs and internal cost allocations Note: These figures represent only the cost of keeping the WCBC Fleet on the road, and exclude the labour costs of the teams which use the vehicles. Source: Chart Overview2.2.xls
The Fleet Strategy addresses the key cost drivers • There are 3 main drivers for vehicle fleet costs, each of which can be improved: • Vehicle utilisation & ownership – The proportion of time when vehicles are actually being used to deliver services, and the choices made about leasing, owning or hiring vehicles, including projected working “life”. This is by far the biggest cost driver for the fleet. • Operating Costs – The “on-the-road” costs of using each vehicle, including fuel management, driver training, vehicle care and damage • Support Costs – The Workshop and maintenance costs to keep vehicles active and fully compliant • Each of these has been analysed for WCBC, and a strategy developed to address and significantly reduce each main cost driver.
Vehicle Utilisation – Key points • The “average” vehicle from the sample is only moving for 4 hours per day, and covers an average of 67 miles. • Approximately 42% of total mileage is stem mileage (including Home to work miles). From sample comparison to Tracker data we believe this is under-reported on the manual data sheets which were completed. • For around 20 hours on each weekday, most vehicles are either: • Parked at their “home” location (depot or driver’s home) • Parked up while other duties are performed or during rest periods or admin tasks • Used as storage facilities (tools, equipment, waste materials), or • Significant opportunities exist to re-think how vehicles are utilised. This will require willingness to challenge current processes and organisation: • Calculate & assess utilisation patterns of each vehicle • Identify specific vehicles to remove from fleet, including vehicle-share opportunities • Generate monthly management information on vehicle utilisation • Maintain review of utilisation levels and challenge all vehicles below 30% Source: Manual Utilisation sheets
Vehicle utilisation is not high – vehicles drive for ~4 hours/day • Vehicles sampled are driving for average of 4 hours per 24 hour weekday period, but this includes Stem mileage. • They are static (parked) away from their base for a further 2 hours while crews work • When Refuse/Recycling is excluded, the Driving figure drops to < 2 hours/day • Based on this sample we estimate the true utilisation figure for WCBC is just over 20% on a 24/5 basis • Good performance across other Council fleets we have worked with would be between 30-35% • For private commercial fleets the figure would be 70%+ • This represents a major opportunity Source: Data compilation for high level stats WCBC Jul11.xls Note: Nov 2011 Tracker data confirms overall Utilisation, but shows less driving and higher parked / static time
Service Example : Housing Services – Nov 2011 analysis • Scheduling/routing of jobs is efficient • 60% of mileage is stem mileage (45mins/day) • Non-Driving time is only 5.5 hours/day • On average 40 vehicles either did not move or drove for less than 1 hour each day Source: Vehicle tracking data, Nov 2011
Vehicle example : Ford Transit Double Cab Tipper - Highways • 120 mins non-driving activity in the morning and afternoon • “Good” use of vehicle capacity – but storing rather than “carrying” except for 2.5 hours during the day CY08 BSV: 12th July 2011
Ownership – Key points Recent purchases financed by sale and leaseback agreement Invitation to tender specifies 5 year primary period plus potential 2 year extension Tender submissions based on annual mileage of 15,000 miles Actual average mileage of recently returned vehicles was <6,500 miles (based on 12 Transit vans returned during July 2011) Actual residual values can be 30% higher than anticipated within lease agreement, all for the benefit of the leasing company Source: Weir analysis of market value of 2 recently off-leased vehicles
Fleet Age profile is uneven and aging • The average age of the WCBC fleet is 4.8 years • This represents an opportunity to implement the Fleet Strategy relatively quickly, without cost penalties on leases Source: Chart Overview 2 1.xls
Vehicle Hire – Key points • WCBC have hired vehicles on 49 occasions in the past 12 months, totalling 4485 days of hire at a cost of £90k • This adds the equivalent of an extra 12 vehicles to the Fleet & risks circumventing the main procurement process • Most of these hires are non-specialist vehicles, whilst utilisation of similar vehicles in the main fleet is low • However, spot hire may still be a valid option as fleet numbers reduce in future (cheaper to hire selectively than to own permanently…) Source: Hired Vehicle Log July11.xls
Improving performance depends on managing the detailed data • There is a clearly a range of different vehicle specs and activity which lies behind these graphs, but… • The Tippers drove 88,000 miles in this quarter • The difference between driving each mile at the best or worst MPG = £9,951 per month • The refuse fleet drove over 55,000 miles in this period • The difference between best & worst MPG is worth £11,813 per month Source: Wrexham fuel data at vehicle level Nov-10 to Jan-11 Fuel costed at here at £1.20 per litre ex VAT
An insight into inconsistent data points… (Environment fuel management system) • 35 vehicles shown as driving more than 100,000 miles each in one year… • Gritters appear to get up to 45 MPG… • To improve performance, detailed data needs to be available & correct. Source: Chart Overview.xls
Utilisation & Ownership of the Fleet – Key Improvements • Rapid reduction in existing fleet to remove surplus capacity identified in this study • Procurement / Replacement freeze without a sound, utilisation-based business case • Replacement vehicles procured using realistic “life expectancy”, and aggressive policy on multi-user sharing of assets • Longer-term review of specialist vehicles at Regional level to identify potential to share with other public sector fleets • Soft market testing of specialist services to ensure good value of in-house arrangements
Vehicle Operating Costs – Key Improvements • Creation of best practice monitoring tools to support cost reductions • Fuel monitoring at vehicle level & tightening of purchase & issue cycle. League tables on driver fuel economy. • Improved data capture & monitoring of on driver checks, compliance checks, insurance & damage • Extended use of Tracker data to optimise routes & reduce costs and carbon footprint • Examine potential for live “tasking” of mobile services within Streetscene & other Services
Support costs & systems – Key Improvements • Develop costed strategy for Workshop requirements based on revised future fleet profile & servicing needs • Agreed policy on targeting external public sector work to recover overhead & use surplus capacity • Standard times for fitters & full review of maintenance scope & periodicity