Download
1 / 16
160 likes | 305 Views
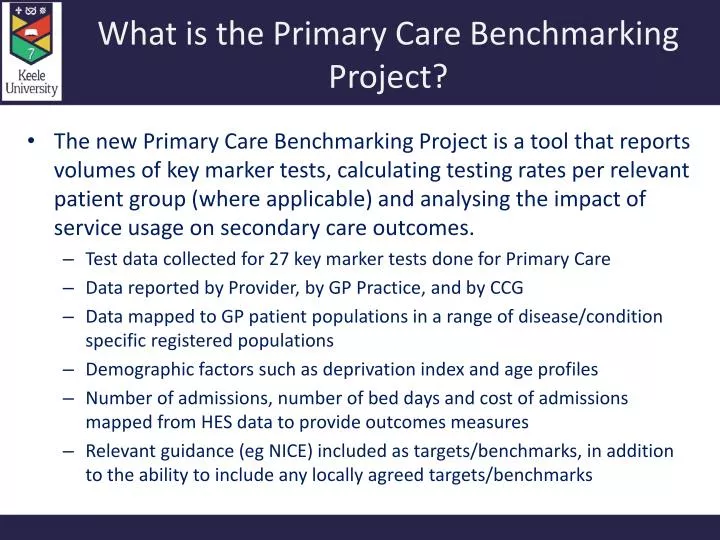
What is the Primary Care Benchmarking Project?. The new Primary Care Benchmarking Project is a tool that reports volumes of key marker tests, calculating testing rates per relevant patient group (where applicable) and analysing the impact of service usage on secondary care outcomes.

E N D
What is the Primary Care Benchmarking Project? • The new Primary Care Benchmarking Project is a tool that reports volumes of key marker tests, calculating testing rates per relevant patient group (where applicable) and analysing the impact of service usage on secondary care outcomes. • Test data collected for 27 key marker tests done for Primary Care • Data reported by Provider, by GP Practice, and by CCG • Data mapped to GP patient populations in a range of disease/condition specific registered populations • Demographic factors such as deprivation index and age profiles • Number of admissions, number of bed days and cost of admissions mapped from HES data to provide outcomes measures • Relevant guidance (eg NICE) included as targets/benchmarks, in addition to the ability to include any locally agreed targets/benchmarks
What is it for? • Enables labs to work with their customers and CSUs to: • Monitor service usage, eg volume of requests • Analyse the impact of appropriate requesting on patient outcomes • Inform demand management (optimisation!) strategy planning • Provide evidence around best practice • Monitor progress over time, assess the impact of any interventions • Key points/objectives are as follows: • Joint working, creating a partnership between provider and customer • Have a positive impact on demand management strategies • Provide new data for research • Make pathology the centre of the patient care pathway, and turn it into the hub of patient care and improvement
Story so far • Began as a joint initiative between Keele and Leeds (YCHI) in 2007 • Originally intended for NHS IC (now HSCIC) to host, but business case fell through • Barnes Quality review work in 2013 identified that this project would still be a valuable tool, particularly once the review was launched (which happened January 2014). • KUBS funded pilot in 2013 took data from two sites – UHNS and Wolverhampton – to prove concept • Now looking to roll out the pilot to interested labs in an ‘offline’ setting, with a view to assessing the viability of an online (and more automated) system further down the line
First of the ‘headline’ examples • Early analyses of the data are already showing some interesting findings: • GP practices who request HbA1c tests within the recommended re-test interval according to NICE guidelines (1-2 tests per year) have 15.3 less diabetes-related emergency admissions per 1,000 patients than practices who request outside of the guidance. • They also have 88.6 less bed days (for diabetes-related emergency admissions) per 1,000 patients • Their cost of emergency admissions for diabetes is £37 per patient lower than those who request outside of the guideline. • There is a genuine incentive for HbA1c tests to be requested on time • In some cases, additional work can lead to savings in secondary care
What will the outputs be? • Proposed short summary report, one-page RAG coded dashboard, varies by target audience • One for each GP practice • One at CCG level • One at lab level • Analysis tools provided so that further ‘drilling down’ into the data can be done in order to answer specific queries • Full training provided, of course! • Quarterly (or monthly if there is a genuine need) updates of workload data to get up-to-date trend monitoring information • GP workshops/interactive sessions to ensure data are having a positive impact
How to report back to GPs? • Needs to be short and to the point • No time to analyse more data or read in-depth reports • Relevant comparisons need to be made • Within ‘peer group’ • Within CCG • Within wider/national context? • Workshops/interactive sessions need to involve representatives from the laboratory and CCG/CSU • Who sends the data to GPs? • Keele to send direct? • Labs provided with the tools to engage with their own GPs/CSUs?
Will it make a difference? • The next 12 months will tell us! • Pilot continuing with North Staffs and Wolverhampton • Data to be presented to CSUs and GPs • Monitor improvements/changes over the course of the pilot • Recommendation has been made within Lancashire CSU for their laboratories to join the pilot • Extending the pilot out to other interested labs • GP workshops at UHNS seemed to make a difference regarding requesting practice as part of the INTERCEPT study, suggesting that engagement between laboratory and customer (using data and evidence) makes a difference
Feedback • Any feedback, suggestions and questions would be most welcome! • Contact me for further information on d.holland@keele.ac.uk or 01782 733277.