Download
1 / 1
10 likes | 123 Views
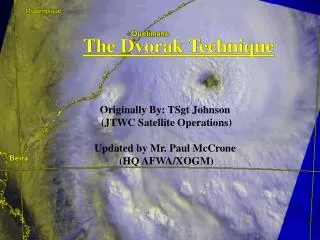
Microwave Imagery. AODT. AMSU. MSLP (hPa). CIMSS AMSU. Dvorak. Bias. 1.0. 1.4. Mean Error. 5.0. 6.3. RMSE. 7.8. 8.9. N. 333. 333. TOWARD AN OBJECTIVE SATELLITE-BASED ALGORITHM TO PROVIDE REAL-TIME ESTIMATES OF TC INTENSITY USING INTEGRATED MULTISPECTRAL (IR AND MW) OBSERVATIONS.

E N D
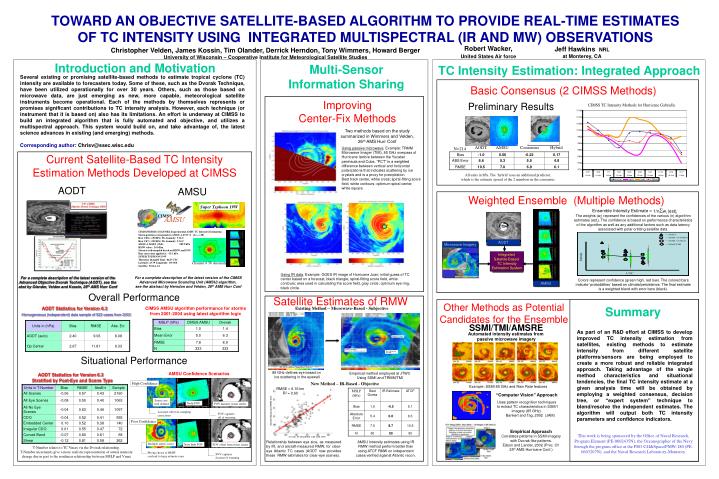
Microwave Imagery AODT AMSU MSLP (hPa) CIMSS AMSU Dvorak Bias 1.0 1.4 Mean Error 5.0 6.3 RMSE 7.8 8.9 N 333 333 TOWARD AN OBJECTIVE SATELLITE-BASED ALGORITHM TO PROVIDE REAL-TIME ESTIMATES OF TC INTENSITY USING INTEGRATED MULTISPECTRAL (IR AND MW) OBSERVATIONS Jeff Hawkins NRL at Monterey, CA Christopher Velden, James Kossin, Tim Olander, Derrick Herndon, Tony Wimmers, Howard BergerUniversity of Wisconsin – Cooperative Institute for Meteorological Satellite Studies Robert Wacker, United States Air force Introduction and Motivation Multi-Sensor Information Sharing TC Intensity Estimation: Integrated Approach Several existing or promising satellite-based methods to estimate tropical cyclone (TC) intensity are available to forecasters today. Some of these, such as the Dvorak Technique, have been utilized operationally for over 30 years. Others, such as those based on microwave data, are just emerging as new, more capable, meteorological satellite instruments become operational. Each of the methods by themselves represents or promises significant contributions to TC intensity analysis. However, each technique (or instrument that it is based on) also has its limitations. An effort is underway at CIMSS to build an integrated algorithm that is fully automated and objective, and utilizes a multispectral approach. This system would build on, and take advantage of, the latest science advances in existing (and emerging) methods. Corresponding author: Chrisv@ssec.wisc.edu Basic Consensus (2 CIMSS Methods) Improving Center-Fix Methods Preliminary Results Two methods based on the study summarized in Wimmers and Velden, 26th AMS Hurr Conf AODT AMSU Consensus Hybrid Using passive microwave. Example: TRMM Microwave Imager (TMI), 85 GHz overpass of Hurricane Isidore between the Yucatan peninsula and Cuba. “PCT” is a weighted difference between vertical and horizontal polarizations that indicates scattering by ice crystals and is a proxy for precipitation. Best track center, white cross; spiral-fitting score field, white contours; optimum spiral center, white square. N=214 Current Satellite-Based TC Intensity Estimation Methods Developed at CIMSS Bias -1.0 0.56 -0.22 0.17 ABS Error 8.6 5.3 5.5 4.8 RMSE 10.5 7.0 6.9 6.1 All units in hPa. The ‘hybrid’ uses an additional predictor, which is the estimate spread of the 2 members in the consensus AODT AMSU Weighted Ensemble (Multiple Methods) Super Typhoon 19W 1/nwi (est)i Ensemble Intensity Estimate = CIMSS The weights (wi) represent the confidences of the various (n) algorithm estimates (esti). The confidence is based on performance characteristics of the algorithm as well as any additional factors such as data latency associated with polar orbiting satellite data. AMSU CIMSS/NESDIS-USAF/NRL Experimental AMSU TC Intensity Estimation: Storm position corresponds to AMSU-A FOV 8 [1<--->30] Raw Ch8 (~150 hPa) Tb Anomaly: 5.36 C Raw Ch7 (~250 hPa) Tb Anomaly: 5.34 C AMSU-A MSLP (Ch8): 909.9 hPa RMW value: 24.0 Km Storm is sub-sampled based on RMW and FOV. Bias correction applied is: -15.1 hPa SUPER TYPHOON 19W Thursday 26aug04 Time: 0447 UTC Latitude: 23.79 Longitude: 135.960 Satellite: NOAA-16 Integrated Satellite-Based TC Intensity Estimation System Channel 8 Tb Anomaly Using IR data. Example: GOES IR image of Hurricane Juan; initial guess of TC center based on a forecast, black triangle; spiral-fitting score field, white contours; area used in calculating the score field, gray circle; optimum eye ring, black circle. For a complete description of the latest version of the CIMSS Advanced Microwave Sounding Unit (AMSU) algorithm, see the abstract by Herndon and Velden, 26th AMS Hurr Conf For a complete description of the latest version of the Advanced Objective Dvorak Technique (AODT), see the abst by Olander, Velden and Kossin, 26th AMS Hurr Conf Colors represent confidence (green high, red low). The colored bars indicate ‘probabilities’ based on climate/persistence. The final estimate is a weighted blend with error bars (black). Overall Performance Satellite Estimates of RMW Other Methods as Potential Candidates for the Ensemble Summary AODT Statistics for Version 6.3 CIMSS AMSU algorithm performance for storms from 2001-2004 using latest algorithm logic Existing Method – Microwave-Based - Subjective Homogeneous (independent) data sample of 522 cases from 2003 Units in (hPa) Bias RMSE Abs. Err. SSMI/TMI/AMSRE As part of an R&D effort at CIMSS to develop improved TC intensity estimation from satellites, existing methods to estimate intensity from different satellite platforms/sensors are being employed to create a more robust and reliable integrated approach. Taking advantage of the single method characteristics and situational tendencies, the final TC intensity estimate at a given analysis time will be obtained by employing a weighted consensus, decision tree, or “expert system” technique to blend/resolve the independent estimates. The algorithm will output both TC intensity parameters and confidence indicators. Automated intensity estimates from passive microwave imagery AODT (auto) 2.40 9.93 8.08 Op Center 2.67 11.81 9.33 Situational Performance AMSU Confidence Scenarios 89 GHz defines eye based on ice scattering in the eyewall Empirical method employed at JTWC Using SSMI and TRMM/TMI AODT Statistics for Version 6.3 Stratified by Post-Eye and Scene Type New Method – IR-Based - Objective High Confidence Example: SSMI 85 GHz and Rain Rate features Units in T-Number Bias RMSE AbsErr Sample RMSE = 6.16 km R2 = 0.60 All Scenes -0.06 0.57 0.43 2160 “Computer Vision” Approach All Eye Scenes -0.08 0.50 0.40 1063 Storm core well defined Uses pattern recognition techniques to extract TC characteristics in SSM/I imagery (85 GHz). Bankert and Tag, 2002 (JAM) Nadir FOV FOV matches storm center All No Eye Scenes -0.04 0.63 0.46 1097 Accurate sub/over-sampling corrections FOV captures all of warming CDO -0.04 0.52 0.41 555 Poor Confidence Embedded Center 0.10 0.52 0.38 140 Irregular CDO 0.01 0.55 0.47 72 Empirical Approach Correlates patterns in SSMI imagery with Dvorak-like patterns. Edson and Lander, 2002 (Proc. Of 25th AMS Hurricane Conf.) Curved Band -0.07 0.80 0.61 68 This work is being sponsored by the Office of Naval Research, Program Element (PE-0602435N), the Oceanographer of the Navy through the program office at the PEO C4I&Space/PMW-180 (PE-0603207N), and the Naval Research Laboratory-Monterey. Shear -0.12 0.81 0.58 262 Relationship between eye size, as measured by IR, and aircraft-measured RMW, for clear-eye Atlantic TC cases (AODT now provides these RMW estimates for clear-eye scenes). AMSU Intensity estimates using IR RMW method perform better than using ATCF RMW on independent cases verified against Atlantic recon. Multiple storm ‘cores’ Near limb FOV FOV offset from storm center T-Number relates to TC Vmax via the Dvorak relationship. T-Number increments give a more realistic representation of actual intensity change due in part to the nonlinear relationship between MSLP and Vmax Wrong choice of RMW can lead to large estimate error FOV captures fraction of warming