Download
1 / 28
280 likes | 352 Views
Building the Electric Grid of the Future in Texas; aka the CREZ Projects. Barry T. Smitherman Chairman, Public Utility Commission of Texas January 27, 2010. Current Policies.

E N D
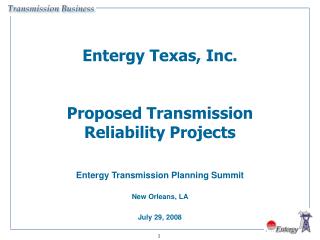
Building the Electric Grid of the Future in Texas; aka the CREZ Projects Barry T. Smitherman Chairman, Public Utility Commission of Texas January 27, 2010
Current Policies • Despite the theater in Copenhagen, and the misguided efforts in Washington to enact meaningful energy and climate change policies… • Texas is leading the nation in: • Renewable energy capacity and generation, • New and innovative technologies, • Deployment of “smart grid” elements, and • Reducing emissions of CO2 and other pollutants.
Texas Electric Market A Puzzle with Four Pieces SPP North Tie 200 MW East Tie 600 MW SPP WSCC ERCOT SERC ERCOT – Electric Reliability Council of Texas SPP - Southwest Power Pool SERC - Southeastern Electric Reliability Council WSCC - Western Systems Coordinating Council Eagle Pass 36 MVA Laredo 100 MW McAllen 150 MW
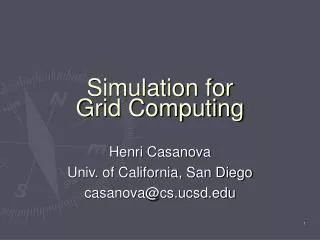
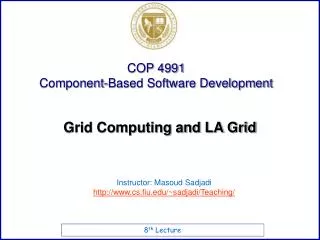
Current SPP Transmission System, With Additional 345-kV Construction Commitments, Approved Balanced Portfolio, Projects, Pending Priority Projects, and Proposed EHV Overlay (Under Study) Balanced Portfolio Projects EHV Overlay Pending Priority Projects
ERCOT Competitive Market • In 1999, the Legislature passed SB 7, which “unbundled” utility services by breaking companies up into three parts: • Generation Companies • Transmission and Distribution Utilities (TDUs) • Retail Electric Providers
Transmission & Distribution Utilities in ERCOT • Own and operate transmission lines—which provide high-capacity transport of electricity—and distribution lines—which bring electricity to individual homes and businesses. • Build new lines to connect new power generation, relieve congestion, increase reliability, and meet the growing demand for power in Texas. • Maintain transmission and distribution lines to ensure continued system reliability. • Read meters and collect usage information. • OVERSIGHT: TDUs are fully regulated by the PUC.
ERCOT – A “Goldilocks” Moment • Smart grid implementation • CREZ Transmission approval, and process build-out • 9000 MW Wind, going to 18,500 MW • Robust resource margins • Low electric prices • Reduction of CO2 emissions between 2004 and 2007
Elements of the Smart Grid • First, build the grid. • In 2008 and 2009, ERCOT transmission service providers have completed improvement projects of approximately 1,137 circuit miles of transmission and about 8,511 MVA of autotransformer capacity, with an estimated capital cost of over $1.38 billion. • Though 2013, planned projects are estimated to cost approximately $3 billion and are expected to improve or add about 3,400 circuit miles of transmission lines. • Additionally, the Public Utility Commission has approved the construction of more than 2,300 miles of high-capacity transmission lines from West Texas, allowing more than 18,000 MW of renewable generation, at a capital cost of nearly $5 billion. • Then, make it smart. • The Commission recently approved the deployment of smart meters in the Oncor, CenterPoint , and AEP service areas, putting more than 6 million smart meters into service over the next several years. • Implementation of the nodal system will allow for more efficient dispatch of generation in ERCOT. • Incent the development and incorporation of PHEV into the grid.
The CREZ Process is a New Process • Typically, transmission is built from generation or to load when there are no lines or when current lines get congested. • Designating the zones and building transmission before the generation is in place is the reverse of what normally happens; removes “the chicken or the egg” problem. • The PUC approved different transmission providers to build the CREZ lines to encourage new market participants rather than the rely exclusively on traditional monopoly utilities.
Transmission Line Approval Process • Utilities must apply to the PUC for a certificate of convenience and necessity (CCN) before it can build a power line. • Under PURA, the PUC must consider factors such as the community, historical, and aesthetic values, and the environmental integrity associated with the transmission line. • Additional factors in PUC rules are whether the routes: • utilize existing compatible rights-of-way, including the use of vacant positions on existing multiple -circuit transmission lines; • parallel existing compatible rights-of-way; • parallel property lines or other natural or cultural features; and • conform with the policy of prudent avoidance. • As all customers eventually pay for transmission lines, cost is also a factor. • A CREZ transmission line must be approved within 180 days, rather then 1 year for other transmission lines, or the application is deemed approved. • A CCN gives utilities the power of eminent domain to obtain the use of private property easements for the power lines.
Wind Generation in ERCOT(Does not include 867 MW in SPP in Texas)
ERCOT System The CREZ projects will involve the construction of more than 2,300 miles of 345 kV transmission lines, enable a total of more than 18,000 MW of wind capacity in Texas, and cost nearly $5 billion Oncor is currently installing more than 3 million smart meters across its service area. Area of best wind generation in Texas AEP will install 1.1 million smart meters in its service areas CenterPoint is currently installing more than 2 million smart meters in its service area. The nodal market design will be implemented for ERCOT, allowing for more efficient pricing, dispatch, and siting of generation
ERCOT in 2013 Assuming 18,000 MW of wind, approximately 5,600 MW of new coal, 4,300 MW of new natural gas
2013 Peak Load Week - Generation by Fuel Type Note – no changes to existing reserves requirements were assumed for this analysis
2013 High Wind Week - Generation by Fuel Type Note – no changes to existing reserves requirements were assumed for this analysis
The American Clean Energy and Security Act of 2009, “Waxman-Markey Bill” and the Clean Energy Jobs and American Power Act, “Boxer-Kerry Bill”
Reduction of CO2 in Texas • A recent report by Environment Texas, “Too Much Pollution,” highlights the decrease of CO2 emissions in Texas over the past several years. • Between 2004 and 2007, Texas saw the second highest total decline in CO2 emissions in the United States. • “On a per capita basis, emissions from electric generators in Texas fell by 4 percent between 2004 and 2007—the result of reduced reliance on coal and an increase in the share of power produced by natural gas and wind.” • “Texas-which is now America’s number one producer of wind power-has been able to use its growing wind power portfolio to reduce the need for additional fossil fuel generation, keeping emission growth from the electricity sector at bay.” • “Texas, meanwhile, has led the nation in wind energy installations, helping to stabilize emissions from its power sector…[showing] that switching from highly polluting fuels such as coal and oil to cleaner sources of power, including renewable energy, can lead to rapid and substantial reductions in emissions.”
Change in Total Carbon Dioxide Emissions from Fossil Fuels, 2004 to 2007
Preparing for Electric Vehicles • Use of EV/PHEVs can help lower emission of pollutants, utilize less fossil fuels as the amount of wind generation in Texas grows, and help address energy security issues by reducing the amount of imported oil. • Powering a car on electricity would result in 93 percent less smog-forming volatile organic compounds and 31 percent less nitrogen oxide emissions than powering a car on gasoline. • Operating costs of plug-in cars are likely to be significantly lower than those of gasoline-powered cars. Electricity costs three to five cents per mile with average electric rates, or the equivalent of $0.75 to $1.25 per gallon of gasoline. • Market participants, such as Reliant, Oncor and TXU, have announced support for deployment of EVs in Texas. • Use of smart meters, with time-of-use products, could help insure that customers charge their vehicles with inexpensive off-peak energy and take advantage of wind energy generated at night.
ERCOT Reserve Margin Changes 2009 2010 2011 2012 2013 2014 2015 May 2007 10.1% 8.3% 6.7% 5.9% n/a n/an/a December 2007 12.1% 14.0% 11.2% 10.5% 8.2% n/a n/a May 2008 16.5% 17.3% 15.0% 14.5% 12.3% n/a n/a December 2008 15.8% 21.2% 18.7% 17.8% 17.9% 15.8% n/a May 2009 16.8% 20.1% 18.8% 17.0% 16.3% 13.9% n/a December 2009 n/a 21.8% 19.9% 18.1% 14.7% 12.3% 10.2% • The following units have recently begun commercial operation, are under construction, or have been announced: JK Spruce 2 for 750 MW (expected completion date of June 2010), Oak Grove 1 (completed) and 2 (mid 2010) for 1710 MW, Sandy Creek for 925 MW (2012), Nueces Bay for 112 MW (1Q 2010), Barney Davis for 348 MW (1Q 2010), Sandow 5 for 581 MW (completed), Limestone 3 for 800 MW (2012) and more than 2,200 MW of wind generation with signed interconnection agreements. • The reduction of the reserve margin in 2013-2015 reflects the exclusion of the Cobisa Greenville Project, a 1,792 MW natural-gas fired plant that was scheduled for completion in 2013, after the company announced a delay in the construction of the facility. • ERCOT only counts 8.7% of wind generation nameplate capacity when calculating reserve margins.
Load Zone Price Data Total Load Weighted Average Price ($/MWH)* [MCPE weighted by Total Zonal Load] *Represents the average price for loads within the zone
Questions? For this and other presentations, go to http://www.puc.state.tx.us/about/commissioners/index.cfm and follow the link for Chairman Smitherman.