Download
1 / 26
260 likes | 375 Views
INDUSTRY National Rankings. Source: Broiler Industry. COMPETITORS Market share info by brand. IFF Share by Brand – Total West.

E N D
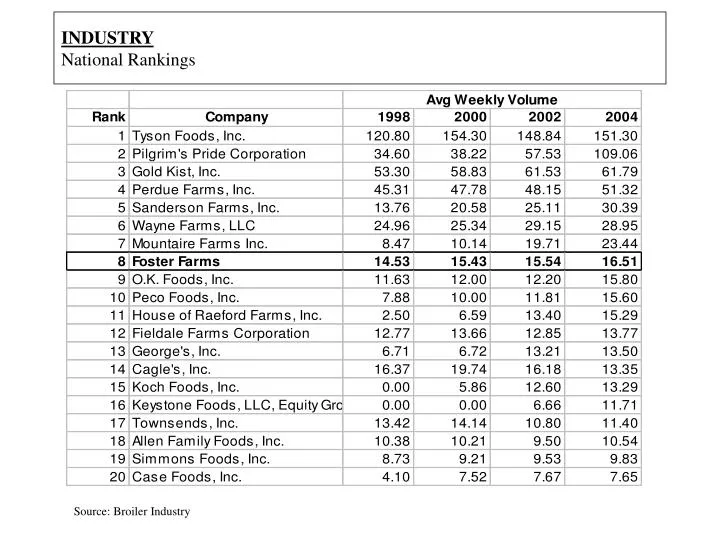
INDUSTRY National Rankings Source: Broiler Industry
COMPETITORS Market share info by brand IFF Share by Brand – Total West
ConsumersFemales continue to be the primary shoppers, but with nearly 60% working, time to shop and cook continues to decline making convenience the most critical factor in purchase decisions. • CONSIDERATIONS • More than 60% of Women over 20 Work(Bureau of Labor Stats) • 2004: 64.7 million women employed in the US • 74% worked full-time and 26% worked part time • The first decline in labor participation rate for women in decades • 2005: the labor force participation rate was 66.1%-- 60% were women over the age of 20 • 2010: 62.2% of women over 20 will work • 2012: women will comprise of 47% of the total labor force, accounting for 55% of the increase in total labor force growth through 2012 • Female Purchasing Power is Growing(Clark 2005, Mouser 2005 and Y&R) • Disposable incomes continue to rise • Women’s median income is up 63% and almost a third of working women out-earn their husbands • Women buy or influence an average of 85% of everything sold in the United States • Working women are just as likely as non-working women to be the primary grocery shopper • Dinner is Often Not Planned(NPD and Y&R) • Dinner is the fastest growing take out meal • 52.2% of all dinners consumed in-home were prepared by female head of household • At 4:00, 50% of women who are responsible for preparing meals have no idea what they are going to serve for tonight’s dinner • Just 16% of families share the shopping chores, and only in 17% of homes are males the primary shopper • Only 39% of shoppers say they do a single stock up trip every week; most average 2.1 trips per week for 54 minutes • The majority (60%) are making fill-in trips within the week – grocery, club, warehouse and convenience • The average shopper shops at 2.2 stores each week to obtain all their items • 70% of fresh chicken that is purchased is placed in the freezer at home
ConsumersChicken, the healthy protein of choice, continues to be a staple in Americans’ diets; however, limited time and cooking skills are shifting consumer part preferences. • CONSIDERATIONS • Consumers Believe Chicken is Healthy (Mintel and Y&R) • 96% of respondents to consumer research indicated they eat chicken • From 2001-2003 chicken consumption increased by 10% • Low carbohydrate-high protein diets drove poultry growth through 2004 • Chicken is viewed by consumers as healthy, versatile, convenient, easy to prepare and inexpensive - across all diet types and recipe variations – transcends ethnicity • When compared to red meat and pork, chicken is viewed as the healthier alternative • “Healthy” was by far the attribute associated with chicken most often by consumers- achieving, preserving a healthier lifestyle and a better chance of longevity • Consumers are more concerned with low fat food choices and this awareness has increased the consumption of boneless skinless breasts as a fast, healthy dinner option • Limited Cooking Ability and Lack of Time are Driving Consumer Decisions for Dinner(Mintel, NPD Y&R) • Cooking skills are decreasing • The desire to have a meal ready in a half hour is increasing • These trends work against products like whole chickens and favor quick cooking products like thin-sliced boneless, skinless breasts • In 2004 the most popular cuts of chicken were wings and breast meat (boneless skinless) • Preference of Parts Varies by Consumer Type(NPD and Fresh Look) • BLSL Breast • 18-34 year old females and males, married, employed *Dollar sales +16.4% vs. YAGO Western US • Income- $20-29K; $60-69K • Whole Birds • 45-55 year old females, 45-65 year old males, unmarried, retired *Dollar sales –4.3% vs. YAGO Western US • Income- $40-49K; $60-69K • Parts • Profile midway between BLSL Breast users and Whole Birds
ConsumersThe need to eat healthier is clear; the desire is not. CONSIDERATIONS • Fewer Americans are Eating at Home (National Restaurant Association, FMI) • More than 47% of the money Americans spend on food is spent at restaurants • Younger males are the least likely to prepare meals at home; older female shoppers are the most likely • 69% of consumers say they eat "fair to poor" diets when eating out; 39% say they eat "fair to poor diets at home (USA Today 2005) • Fewer Families are Eating Together (Harvard Medical School) • Less than 1/3 of children sit down to eat dinner with both parents • obesity rates are 15% lower among children (aged 9-14) who eat dinner with their family on “most days” or “every day” • A Need to Eat Healthier Exists • In a consumer panel held by Supermarket Guru, 52% wanted to eat more low fat foods, 49% wanted to cook more meals from scratch at home (Supermarket Guru Consumer Panel) • Only 42% of shoppers are familiar with the USDA’s new dietary guidelines (FMI) • 64.5% of Americans over the age of 20 are either overweight or obese; 50 million go on diets each year (CDC, Journal of the American Medical Association) • 90% of Americans and Europeans feel that improving health is important while only 64% claim to have taken “steps” to improve their health (Datamonitor 2005)
ConsumersWith nearly 40% of Americans purchasing some sort of organics, it continues to be an area with great opportunity for growth. CONSIDERATIONS • According to the Organic Trade Association, 39% of the US population use organic products. • Consumption of organic products is driven primarily by person’s life stage and life style, not by demographics* • Organic consumers are loosely defined* as those who: • Are proactive and responsible for own heath and health of family • Have increased reliance on food as preventative medicine and perceived wellness benefits, therefore a greater concern for food safety • Accept they may have to pay more for specific organic foods and are willing to do so because of the high value equated with certain items • To a lesser extent, looking for a gourmet or specialty food experience • Health and gourmet adaptations of organic foods leads organic consumers to believe organic foods are superior in taste, safer, and healthier.
ConsumersWith nearly 40% of Americans purchasing some sort of organics, it continues to be an area with great opportunity for growth. • Core (10%);Mid-Level, a.k.a. “Messy Middle” (53%);Periphery (37%) • Segmentation of organic consumers is dependent on intensity of lifestyle • and usage occasion * Hartman Group, as presented at the 2004 All Things Organic Trade Show. **Organic Trade Association Website, www.OTA.com.
ConsumersConsumers concerns regarding ‘safety’ of chicken are heightened. There is increasing consumer and activist awareness of treatment of chickens, antibiotics and avian influenza. CONSIDERATIONS • People for the Ethical Treatment of Animals (PETA) has a Strong Voice • Waging intensive campaigns against companies • McDonald’s introduced “Animal Welfare Guidelines” • Supermarkets - PETA has now turned their attention to the grocery industry--we have been contacted by four key accounts regarding our production standards • American Humane Association’s new “Free Farmed” program certifies farms and processors that adhere to relatively strict animal-welfare standards • Confusion and Concern over use of Antibiotics Increases (Wall Street Journal 2005, FDA) • Responding to consumer concerns, the FDA recently banned the use of Baytril in poultry production • Many consumers are confused by the numerous labeling terms associated with antibiotics used in meat and poultry production • Denmark, the leading pork exporter, recently banned the use of sub-therapeutic antibiotics and as a result, therapeutic use increased by 30% to 40 % • Avian Influenza is Another Consumer Concern (CDC, Emerging Infectious Disease Journal) • Expanded news coverage of Avian Influenza has many consumers concerned about the risk of infection in the U.S. In order to affect humans, the virus would have to mutate into a strain that would be easily spread, then migrate from Asia to the United States. To date, H5N1, the current strain affecting Asia, has not been present on this continent • The U.S. poultry industry is currently working with national and global public health officials to prepare for the disease should it spread to our continent
ConsumersConsumers concerns regarding ‘safety’ of fresh meat and chicken are heightened. There are increasing consumer concerns with regard to food-borne illness, arsenic and mad cow disease. CONSIDERATIONS • E. Coli/ Campylocater/Salmonella/Listeria Food-Borne Illness (CDC) • Food-borne illness has generally been on the decline since 2002 when the USDA’s Food Safety and Inspection service launched national consumer awareness campaigns • The more information provided to consumers on labels, the more likely they are to follow food safety advice • Foster Farms’ consumer hotline is a recommended resource for consumers with poultry-related food safety questions • Arsenic (EPA, Consumer Reports) • Consumer news media has increasingly covered news about arsenic traces in poultry products, due to feed additives which contain trace amounts of the natural substance • In January 2005, Consumer Reports found Foster Farms products to be the only non-organic poultry brand without trace amounts of arsenic • Mad Cow Disease (BSE) (U.S. Center for Food Safety) • Bovine Spongiform Encephalopathy primarily affects cows and cattle used for beef processing; however, consumers are often confused about poultry’s connection with livestock feed issues which receive publicity during BSE coverage • Consumer purchase changes during publicity of Mad Cow disease may lead consumers to choose poultry products over beef products (Standard and Poor’s Equity Research) • Two confirmed cases of BSE have recently occurred in the U.S.: Texas in 2005 and Washington in 2003
ConsumersHispanics shop for, home-cook, and eat more chicken than general market consumers, but they have less disposable income. CONSIDERATIONS • Hispanics are a Growing Percent of the American Population • Since 2000, the Hispanic population has grown four times the general market, reaching a national population of 40 million • Hispanics are Key Grocery Store Consumers (FMI) • Hispanics represent 26% of grocery shopping and 30% of chicken purchases • The primary shopping destination for Hispanics is the grocery store - 94% visit supermarkets – rather than club stores • Hispanics spend $133 per week on groceries, 31% more than the general market who spend on average $91 per week • Hispanics average 26 grocery trips per month, three times the national average • Hispanics Cooking Style Drives their Consumption of Fresh Chicken (FMI) • Traditional “from scratch” cooking occurs more in Hispanic households then in general market households • Chicken is overwhelmingly preferred to other types of meat • 85% Chicken vs. 58% Beef and 34% Pork • Hispanics Acculturate vs. Assimilate and will continue to Speak Spanish (FMI) • Hispanics Prefer to Purchase “Brands”, especially those that have an Established ‘Relationship’ with Hispanic Consumers (FMI) • Hispanic incomes tend to average 30% less than non-Hispanics • $27,000 for Hispanics vs. $38,000 for non-Hispanics • Hispanic mean HHI is $45,701
ConsumersComprising more than a quarter of our population, wealthy and aging, Baby Boomers will cause manufacturers to re-think the way they go to market. CONSIDERATIONS • Baby Boomers are The Key Consumer Segment (Metlife) • Currently 76,957,164, representing 26.75% of the population • 9.81MM live in California • Make up 30.2% of Oregon’s population • Baby boomers: age 41-59, born 1946-1964 • Younger Boomers: born 1956-1964 • Older Boomers: born 1946-1955 • 49% are male, 51% are female • The American Population is Aging (Metlife and CIA) • By 2030, baby boomers will be ages 66-84 and will make up 20% of the total population • Today, adults ages 65+ years make up 12.4% of the total population • This Generation is Wealthier and more Highly Educated than previous generations (Metlife and CIA) • In 2004, the total purchasing power parity was $11. 75 trillion • The estimated total spending power for baby boomers is $2 trillion, with households spending upwards of $45,000 per year • Younger Boomers spend their money on their children and their mortgage • Older Boomers are empty nesters using their money for upgrading their homes
ConsumersBaby Boomers fresh chicken consumption continues to grow, especially as concerns about health take a greater precedence in their lives. CONSIDERATIONS • Fresh Chicken Consumption for Adult Male Boomers is Increasing (NPD) • Adult males ages 55-64 are consuming more fresh chicken in the Pacific Division. • Adult males ages 35-44 in the Pacific division are eating fresh chicken more often. • Fresh Chicken Consumption for Female Boomers is Increasing (NPD) • Adult females ages 55-64 are consuming more fresh chicken overall • Adult females ages 45-54 are increasingly consuming more fresh chicken in the Pacific Division • Prominent Concern for Boomers is Health and Wellness (NPD) • US female baby boomers are concerned with healthy lifestyles, diet, exercise, comfort and products to better their lives and looks (Boomersint) • Baby Boomers, currently in their fifties, may be forced to change their eating habits to address health and weight issues (TheMatureMarket) • A report found that one-third of all boomers are overweight and about 30% are obese • As a group they are more worried about fat, salt, cholesterol and sugar in their diet • Good nutrition among aging baby boomers is important to help lessen the effects of diseases such as, osteoporosis, obesity, high blood pressure, heart disease, cancers, etc. (Agingwell)
ConsumersGeneration Y, the future consumer, is spending more than prior-teens and is heavily influenced by convenience. CONSIDERATIONS • Gen Y is a Large and Diverse Group (MerrillAssociates and Faust 2001) • Generation Y consists of those born between 1980-2002 (ages 3 - 25); also called the Millennial Generation • There are about 65 million, less than baby boomers, but three times larger than Generation X • The most ethnically diverse generation yet • They’re Young and Carefree • In February of 2004 a study conducted on food preparation habits found adults ages 18-24, like to prepare food but have limited time and limited skills (Mintel) • Gen Y is exposed to more income thus spending more, about $90 a week (Siskiyous) • The Internet Generation as consumers spend more time online than watching TV (McKinsey Quarterly) • They are heavily influenced by their peers and brand names (Faust 2001) • They are over-achievers, over-scheduled, never knowing the slow pace of life (MerrillAssociates) • Convenience, Convenience, Convenience in Food and Everything (NACS Online 2005) • Looking for convenience in their food choices • Prone to reach for more healthy and convenient food options • They are the consumer of bagged salads and prepackaged meals • As consumers they are driven by convenience and cost-efficiency • Like their mothers and fathers, They Eat Chicken (NPD) • Kids and Teens consume their fair of fresh chicken in the Pacific and beyond • Teen consumption of fresh chicken in the Pacific Division is more volatile • The older female in Gen Y consumes a fair amount of fresh chicken in the Pacific Division
ConsumersOur consumer and the use of media has changed as more adults are using the internet as a main resource for information on health and diet as well as information about products and services. CONSIDERATIONS • Media Consumption Remains Strong via a Wide Variety of Mediums • Television remains the number one choice of media consumption among the overall population • Hispanics remain heavy radio users (Arbitron) • The baby boomer generation is extremely tech-savvy with over 50% having internet access (Genpolicy) • There are 182 million Americans that are wireless subscribers and 200,000 times a day someone uses a wireless phone to call for help (CITA) • The Internet is a Primary Source of Media Consumption for Most Americans • The internet is the number one choice of media consumption among teens • By 2010, television advertising could only be 35% as effective as it was in 1990 (McKinsey 2005) • 144 million adults are online (MPG) • 52% of Hispanic adults own a computer and the use of the internet among this consumer is increasing (Arbitron) • Adults simultaneously watch TV and surf the web, which opens an opportunity for multi-channel campaigns (McGann 2004) • 78% of adult internet users research products and services (Burns 2005) • Eight in ten internet users look for health information online
ConsumersIn their quest for solutions and answers, women are spending more time on line than ever before. CONSIDERATIONS • There are more women online than men (Pew/Internet) • Internet usage among Moms has more than doubled in the last 5 years • 96% of Foster Farms bullseye target has internet access • Nearly 75% of them access the Internet 3+ times per week • Moms spend more time on the Internet than they do watching television • 13.2 hours/week online vs. 7.6 hours/week for TV • Light TV viewers are especially heavy online users • They are seekers, not browsers • They are online to find solutions • They rely on the Web for parental guidance and advice • They embrace Internet ads that offer family-related ideas, tips and suggestions • 43% use the Internet as a shared activity with their children • 82% of women online search for health related information (Pew/Internet)
ConsumersMedia consumption is at an all-time high via a wide variety of mediums, but consumers have more control today than ever before over what messaging they see and when and where they see it, making it more difficult to reach them effectively. CONSIDERATIONS • “Breaking Through” is Increasingly More Difficult (Nielsen) • The average consumer chooses from • 93 TV Channels • 25+ Local Radio Stations • 2,493 Magazine Titles • Billion of Internet Sites • 6 Daily Newspapers • Consumers today encounter 3,500 to 5,000 marketing messages per day versus 500 to 2,000 in the ’70s • At the same time, consumer consumption of media continues to grow averaging 10.29 hours per day (Veronis Suhler Stevenson 2004) • And consumers are paying more than ever for their media, $68.77 per month • More than 70% of consumers use media simultaneously (BIGresearch SIMM Study) • While watching TV, 74% of people also read the newspaper and 66% are also online • While listening to the Radio, 57% of people go online, 47% read the newspaper, and 18% watch TV • Advances in technology are giving consumers unprecedented control over the programming they consume and when they consume it: Arbitron/Edison Media Research 2005—Population 12+
Consumer Matrix- Ages relevant as of 2005 and based on US Census projections for 2005. (US Census projections 2005 and 2010, Tusi 2001, Mosier 2001, FindArticles, InsuranceNews)
References Reports • Pew/Internet. “Health Information Online”. May 17, 2005 • Standard Poor’s Equity Research. 2004 • Supermarket Guru Consumer Panel. 2005 • US Center for Food Saftey. 2005 • Y&R. “The Consumer”. 2005 • Y&R. “Driving Consumer Traffic On-Line”. 2005 Websites • Agingwell. www.agingwell.state.ny.us/eatwell/articles/growing.htm • Bureau of Labor Stats. www.bls.gov • Boomersint. www.boomersint.org • CDC. United States Center for Disease Control and Prevention. www.cdc.gov • CIA. www.cia.gov • CITA. Cellular Telecommuniations and Internet Association. www.cita.org • Emerging Infectious Diseases Journal. www.cdc.gov/ncidod/EID/ • Environmental Protection Agency. www.epa.gov • Food and Drug Administration. www.fda.gov • Genpolicy. www.genpolicy.com • FindArticles. www.findarticles.com • InsuranceNews. www.insurancenewsnet.com/article.asp?a=top_news&inid=289892156 • Journal of the Medical Association. http://jama.ama-assn.org • MerrillAssociates. www.merrillassociates.net • MetLife. www.metlife.com • National Restaurant Association. www.restaurant.org • Siskiyous. www.siskiyous.edu/pio/newscolumns/Meet%20Generation%20Y.htm • TheMatureMarket. www.thematuremarket.com
STRATEGY AND DIRECTIONSAVORY SERVINGS • Vision • With Foster Farms Savory Servings product line, we will continue to target consumer needs by offering marinated chicken products that provide quick, easy, and healthy meal solutions for today’s busy consumer. • Primary Objectives • Increase awareness and trial of the Savory Servings sub-brand • Drive consumer interest in and loyalty to the Savory Servings sub-brand • Increase distribution of existing line and gain distribution of line extensions • Continue to profitably grow Savory Servings volume • Primary Strategies • Feature Savory Servings on Foster Farms website and in media appearances • Participate in Foster Farms in-store seasonal consumer promotions • Optimize current POS program to strengthen in-store presence and maintain distribution • Utilize in-store merchandisers to improve distribution and minimize out of stocks • Optimize existing flavors while strategically introducing rotational flavors • Conduct quarterly competitive and quality reviews • Drive volume with strategic pricing and promotional programs • Monitor Costco distribution and same store sales; close gaps using demo support
OBJECTIVES Continue to drive consumer interest in and loyalty to the Savory Servings product line STRATEGIES Continue to provide consumers and retailers with new and exciting rotational flavors Continue to evaluate packaging and identify areas for opportunity Maintain quality action program of cuttings + store checks; use to provide direction for product improvements PRODUCTS & PACKAGINGSAVORY SERVINGS • TACTICS • Launch one rotational flavor, specifically targeting the grilling season • Replace lowest performing SKU (Q2) • Review fresh meat category for key retailers and recommend placement of line extension items (Q2) • Conduct competitive review quarterly • Monitor consumer and retailer feedback (ongoing) • Monitor quality feedback from the field – MSS (ongoing) • Conduct quarterly store checks
OBJECTIVES Consistently communicate the brand promise of “Healthy, Convenient & Delicious” Maintain and strengthen in-store presence STRATEGIES Reinforce position through promotions and demos Utilize attention-grabbing POS to enhance in-store presence PROMOTIONSSAVORY SERVINGS • TACTICS • Participate in Foster Farms company-wide in-store seasonal promotions (ongoing) • Utilize targeted demos at key customers (ongoing) • Utilize strategic couponing to drive trial and awareness • Update Savory VIP Coupon Brochure and create a brochure with usage ideas (Q1) • Modify and develop effective POS (Q1) • Identify key account to test POS opportunities (Safeway) (Q1) • Utilize merchandising team to ensure authorized POS is installed and refreshed on a monthly basis (ongoing)
OBJECTIVES Profitably maintain and grow Savory Servings volume STRATEGIES Monitor ad accrual rate and ad allowance program to ensure incremental business building at strong margins Monitor retail price and unit ring PRICINGSAVORY SERVINGS • TACTICS • Monitor weekly ads • Periodically analyze ads, ad pricing, and Foster Farms margin • Address issues with appropriate sales rep • Review case weights and unit rings quarterly • Review retailer base and ad pricing quarterly
OBJECTIVES Profitably maintain and grow Savory Servings volume STRATEGIES Ensure ad activity for Savory Servings tray packs and WOG at all key retailers when availability permits Utilize merchandisers to close distribution gaps and secure shelf space PLACEMENTSAVORY SERVINGS • TACTICS • Maintain current deal structure; pre-planning ad activity with key accounts on a quarterly basis • Monitor in-stock percentages by retailer on a monthly basis • Merchandisers utilize upcoming retailer ad schedules to secure extra facings (ongoing) • Costco – monitor same store sales on a quarterly basis • Use demos to close distribution gaps
2006 HISPANIC PR HIGHLIGHTSFRESH CHICKEN • Introducing… Manuel Villacorta • Registered Dietitian & Nutritionist, Professor of Nutrition at SFU; in private practice with over 8 years of experience • B.S. Nutrition & Physiology Metabolism UC Berkeley & Master of Science in Nutrition, San Jose State University
Coastal Range Organics • Positioning Statement: Our goal is to provide consumers with the highest quality organic chicken conveniently available at their local traditional grocery store • Objective: to grow sales by 25% by end of 2008 • Customer Target: • Stores that currently carry FF chicken • Consumers who shop at store that carries FF chicken • Competitor Target • Petaluma’s Rosie • Colemans Chicken • MBA chicken • Red Bird chicken • Top three Strategies • Drive consumer awareness and trial of the Coastal Range Organix brand • Achieve distn in all acct that carry FF chicken • Leverage FF resources
Coastal Range Organics • Strategy • Drive consumer awareness and trial of Costal Range Organic chicken • Tactics • Design impact POS material to be utilized in stores • Work with in-store merchandising team to install and maintain POS in stores • Implement demo program for top 5 customers, offering product demo 1x per month • Cross-coupon with organic herbs (Simply Organic) • Cross coupon with organic produce (Simple Fresh) • Purchase one-page ad in Self, Body+Soul, Cooking Light, Sunset