Download

1 / 41
410 likes | 558 Views
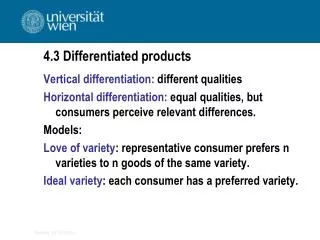
Industry Empirical Studies Differentiated Products Structural Models. Based on the lectures of Dr Christos Genakos (University of Cambridge). OUTLINE. Product Differentiation and Demand Estimation Estimation Challenges Multilevel Demand Models Example: Hausman (1996)

E N D
IndustryEmpirical StudiesDifferentiated Products Structural Models Based on the lectures of Dr Christos Genakos (University of Cambridge)
OUTLINE • Product Differentiation and Demand Estimation • Estimation Challenges • Multilevel Demand Models • Example: Hausman (1996) • Random Utility Demand Models • Example: Nevo (2001)
Product Differentiation and Demand Estimation • In our last lecture we analyzed how to estimate market power using a market-level model in which all firms sell a homogeneous product • Today we are going to extend these methods to analyze market power in multiproduct differentiated products markets • Help us understand empirically the role of product differentiation (vertical, horizontal or both) in determining market power • Use these models to examine various important policy questions and how factors other than product differentiation affect market power
Why do we care about Demand? • This is THE major tool for comparative static analysis of any change that does not have an immediate impact on costs • Optimising firm level pricing and product "placement" decisions • Measuring effective competition between products/firms (essential input into any merger and anti-trust analysis) • Measuring welfare impact of introduction of new products or regulation (taxes, patents, regulatory delay) • Consumer Price Index measures
Why is Demand so central? Assume we observe J differentiated products and each has aggregate demand: Suppose there are F firms, each producing a subset Ff of the J different brands. The profits for each firm f are Assuming that a pure-strategy equilibrium in prices exist, then the price pj of any product j produced by firm f must satisfy: The set of J such equations imply price-cost margins for each good
Why is Demand so central? To solve for the mark-ups, define: So we can write the FOC in vector notation Which gives us the pricing equation The markup vector depends only on the parameters of demand and the equilibrium price vector
Why is Demand so central? Different competition models can be nested within this framework Assume two firms with two products each: Single product Nash Bertrand Multiproduct Nash Bertrand Tacit Collusion
OUTLINE • Product Differentiation and Demand Estimation • Estimation Challenges • Multilevel Demand Models • Example: Hausman (1996) • Random Utility Demand Models • Example: Nevo (2001)
Estimation Challenges • The most intuitive way to model demand for products j=1,...,J is to specify a system of demand equations: • The main focus of the early demand literature was to specify f(⋅) in a way that was both flexible and consistent with economic theory • There are three main problems applying any of these methods to estimate demand for differentiate products: • Dimensionality problem - curse of dimensionality • Multicollinearity of prices and price endogeneity • Consumer heterogeneity
OUTLINE • Product Differentiation and Demand Estimation • Estimation Challenges • Multilevel Demand Models • Example: Hausman (1996) • Random Utility Demand Models • Example: Nevo (2001)
Multilevel Demand Models One approach to solving the dimensionality problem is to divide the products into smaller groups and allow for a flexible functional form within each group The justification of such a procedure relies on two closely related ideas: the separability of preferences and multi-stage budgeting Separability of preferences: If this holds commodities can be partitioned into groups so that preferences within each group are independent of the quantities in other groups Multi-stage budgeting: This occurs when the consumer can allocate total expenditure in stages; at the highest stage expenditure is allocated to broad groups, while at lower stages group expenditure is allocated to sub-groups, until expenditures are allocated to individual products.
Multilevel Demand Models The two notions, of weak separability and multi-stage budgeting, are closely related; however, they are not identical, nor does one imply the other Weak separability is necessary and sufficient for the last stage of the multi-stage budgeting, multi-stage budget shares allows one to derive the price index for the group without knowing the "income" allocated to the group
An Almost Ideal Demand System (AIDS) for Differentiated products Originally AIDS model was developed for the estimation of broad categories of product (Deaton and Muellbauer, 1980) - Relative successful Hausman, Leonard and Zona (1994), Hausman (1996) and Hausman and Leonard (2002) use the idea of multi-stage budgeting to construct a multi-level demand system for differentiated products
An Almost Ideal Demand System (AIDS) for Differentiated products • The actual application involves a three stage system: • the top level corresponds to overall demand for the product (beer or ready-to-eat cereal, in their applications) • the middle level involves demand for different market segments (for example, family, kids and adults cereal) • and the bottom level involves a flexible brand demand system corresponding to the competition between the different brands within each segment • For each of these stages a flexible parametric functional form is assumed.
OUTLINE • Product Differentiation and Demand Estimation • Estimation Challenges • Multilevel Demand Models • Example: Hausman (1996) • Random Utility Demand Models • Example: Nevo (2001)
Hausman (1996): valuation of new goods Ready-to-eat cereal industry Very concentrated industry: C4>94%, leading sellers made very high profits consistently, not successful entrant last 50 years! Huge variety of new products but very few survive Big sunk cost in advertising; "store brands" getting stronger Question: Introduction of Apple-Cinnamon Cheerios by General Mills in 1989 (vs. Cheerios and Honey-Nut Cheerios!!!)
Empirical Framework • Estimate demand system AFTER introduction of new good • Recover expenditure function: • Let pn* be the virtual price defined implicitly by the solution to the equation: • Taking that as the price of the new good in the base period, calculate the expenditure level that would have made the consumer indifferent between having or not the new good given prices of all other goods • Then e*/e are the benefits from the new good
Demand Specification Demand model in three steps: 1.Lowest level: demand for brand j within segment g in city c at quarter t is where sjct is the dollar sales share of total segment expenditure, ygct is the overall per capita segment expenditure, Pgct is the price index and pkct is the price of the kth brand in city c at quarter t. 2.Middle level: demand models the allocation between segments : where qgct is the quantity of the gth segment in city c at quarter t, yRct is the total cereal expenditure and πkct are the segment price indexes for each city
Demand Specification • 3.Top level: demand for the product itself is specified as • where qt is the overall consumption of cereal at quarter t, yt is disposable real income, πt is the deflated price index for cereal and Zt are variables that shift demand including demographics and time factors • IV: prices of the same brand in other cities (after controlling for city and brand fixed effects) • Data: Scanner data aggregated over brands at the city level over 137 weeks
Results and Discussion • Demand estimates and elasticities look reasonable (atlhough some cross price elasticities are negative even within segments) • Hausman calculates the consumer welfare to be $32,268 per city, weekly average, or $78.1 million!!! • One problem with this methodology is that it ignores the reactions of the prices of other goods when the new good is not in the market • Fundamental problem is that we are projecting demand where there is no information. To get the value of the new good we need to integrate from the virtual price down and typically there are no observations near the virtual price. (with demand on the characteristics space, at least there might be other products with some similar characteristics as the new good)
AIDS for Differentiated Products - Discussion • Advantages: • model is closely linked to the neo-classical demand theory • it allows for a flexible pattern of substitution within each segment • it is relatively easy to estimate • Disadvantages: • although the demand within segments is flexible, the segment division is potentially very restrictive • the allocation of products to different segments is highly subjective • the multi-level demand system does not fundamentally solve the dimensionality problem • the structure of the segments and the products that belong to each segment are essentially the same over time • no heterogeneity-distributional aspects of changes
OUTLINE • Product Differentiation and Demand Estimation • Estimation Challenges • Multilevel Demand Models • Example: Hausman (1997) • Random Utility Demand Models • Example: Nevo (2001)
Random Utility Demand Models Products as a bundle of characteristics (Lancaster, 1966) Consumer preferences are defined over the characteristics space, rather than the products themselves → dimensionality problem solved! Each consumer chooses bundle that maximizes its utility. Consumers have different relative preferences → heterogeneous preferences. Aggregate demand is the sum over all individual demands → depends on entire distribution of consumer preferences.
Random Utility Demand Models • Products' characteristics play two separate roles: • they are used to describe the mean utility level across heterogeneous consumers • guide substitution patterns: products with similar characteristics will be closer substitutes. • In other words, discrete choice models operationalize the notion of "how close products are" with reference to the products' characteristics (not constrained by a-priori market segmentation).
Random Utility Demand Models • Each individual i faces the following problem: • where xj denote the vector of product characteristics for j=0,1,2,...,J, pj denote the price of that good, vi represents consumer preferences and θ determines the impact of those preferences on utility. • Individual i chooses product j if and only if: • Product 0 is the "outside" good (it is the good not competing with the goods in the industry and hence whose price and quantity is set exogenously). If there is no outside good we can not use the model to study aggregate demand.
Random Utility Demand Models Hence for a given preferences θ, Aj is the set that lead to the choice of good j: Let f(v) be the distribution of preferences in the population, then the market share of good j is: where (x,p) denote the vector of characteristics of all products in the market. Total demand will be given by Msj(x,p;θ), where M is the total number of consumers.
Example: Multinomial Logit Model Assume that individual's preferences differ only by an additive term In other words, consumer's type is now: MNL (McFadden, 1973) assumes that εi is distributed in an independent and identical way across i and j with a "type I extreme value" distribution The extreme value assumption has a wonderfully nice implication: integral of aggregate demands is analytic!
Unobserved product characteristics: Berry (1994) • One possible source of error is unobserved or unmeasured product characteristics. • Berry (1994) contains the first explicit treatment of this. Assume utility that individual i gets from good j is • where xj is the vector of observed product characteristics and ξj is the unobserved (to the econometrician) product characteristic. • Consider a demand equation that relates observed market shares, Sj, to the market shares predicted by our model, sj: • This is a system of J-1 equations and J-1 unknowns (outside good and J inside goods).
Unobserved product characteristics: Berry (1994) • For each θ there is only one ξ that makes the predicted shares equal to the observed shares • Therefore, conditional on the true values of δ, the model should fit the data exactly: "invert" the demand model to find ξ as a function of the parameter vector • Precisely how we do this depends on the functional form of the demand model • But once we have ξ(θ), this is our error term and can proceed as in a normal estimation procedure by minimizing the sample analog of those disturbances to make them as close to true as possible
Multinomial Logit (revisited) Remember from our MNL the market share for each good is With the mean utility of the outside good normalized to zero Then So δj is uniquely identified directly from a simple algebraic calculation involving market shares. So estimating the MNL model with an "unobserved" product characteristic boils down to just running a nice linear regression!!! ∙ All we need is to find some instruments for price and we can estimate that in any standard econometric software package
Problem with simple Logit model For the own and cross price elasticities we get: Problems: 1.Own-price elasticities are proportional to own price; the lower the price the lower the elasticity, which implies higher markups for the lower priced goods. 2.Cross-price elasticities between ANY pair of products are entirely determined by one parameter and the market share and price of that good: consumers substitute towards other brands in proportion to market shares, regardless of characteristics (also small sk, means small elasticity).
Problem with simple Logit model Example: If the price of a Lexus (price=40, mkt share=.05) goes up, then the impact on demand for BMW (price=55, mkt share=.01) and Yugo (price=8, mkt share=.01) are the same! Our elasticities are determined by the structure of the model (α=-2) and not the data! Solution: relax the IID assumption, such that elasticities depend on how close products are in the characteristics space. A large empirical literature relaxes this assumption and gets more realistic own-cross price elasticities
OUTLINE • Product Differentiation and Demand Estimation • Estimation Challenges • Multilevel Demand Models • Example: Hausman (1997) • Random Utility Demand Models • Example: Nevo (2001)
Nevo (2001): Measuring market power in cereals Charecteristics of the ready-to-eat cereal industry same as discussed before in Hausman. Question: Are the high profits and markups observed in this industry due to: product differentiation? Portfolio effect? or collusion? Utility for each consumer is given where α andβ have now a common across consumers component and an individual consumer component that is based on demographics and unobserved preferences
Key Hypotheses and Data Markups are given by: By varying the ownership matrix, Nevo can distinguish between the three hypothesis. single product firms→ product differentiation, multiproduct firms→ portfolio effect, single monopolist→collusion Data: Market shares, prices and brand characteristics (sugar, mushy, fiber, fat), advertising and information on demographic characteristics Scanner supermarket data: aggregate to brand at city level for each quarter (65 cities, 6 quarters, top 25 brands) Instruments: since he controls for brand and demographic mean effects, city specific valuations are independent across cities→hence prices of the same brands in other cities are valid IV
Results and Discussion • Rich dataset, good identification and interesting interactions (children makes you less price sensitive and hate fiber, income makes you less sensitive but at a declining rate, richer people hate mushy less but don't like sugar etc) (Table VI) • Sensible own and cross price elasticities (Table VII) • Margins and hypothesis testing (observed margin 46%) (Table VIII) • Discussion • exceptionally good dataset, IVs?
Differentiated Products Structural Models: References *Berry, S (1994) “Estimating Discrete-Choice Models of Product Differentiation”, Rand Journal of Economics, 25:242-262. *Hausman, J. (1996) “Valuation of New Goods Under Perfect and Imperfect Competition”, in Bresnahan and Gordon eds., The Economics of New Goods, NBER. *Nevo (2001) “Measuring Market Power in the Ready-to-Eat Cereal Industry”, Econometrica, 69:307-342. *Nevo (2000) “A Practitioner’s Guide to Estimation of Random-Coefficients Logit Models of Demand”, Journal of Economics and Management Strategy, 9:513-548. Berry, S., Levinsohn J. and Pakes, A. (1995) “Automobile Prices in Market Equilibrium”, Econometrica, 63:841-890.
Next time: Studies on Price Discrimination, New Products and Mergers *Verboven, F. (1996) “International Price Discrimination in the European Car Market”, Rand Journal of Economics, 27:240-268 *Petrin, A. (2002) “Quantifying the benefits of New Products: The Case of Minivan”, Journal of Political Economy, 110, 705-729 Nevo, A. (2000) “Mergers with Differentiated Products: The Case of the Ready-to-eat Cereal Industry”, Rand Journal of Economics, 31:395-421. Genakos, C. (2004) “Differential Merger Effects: The Case of the Personal Computer Industry”, LBS mimeo and STICERD wp No. EI/39.