Download
1 / 48
480 likes | 707 Views
GPS Heights Primer. Chris Pearson 1. 1 National Geodetic Survey 2300 South Dirksen Pkwy Springfield IL. To understand how to achieve GPS-derived orthometric heights at centimeter-level accuracy, three questions must be answered:. 1) What types of heights are involved?

E N D
GPS Heights Primer • Chris Pearson1 • 1National Geodetic Survey 2300 South Dirksen Pkwy Springfield IL
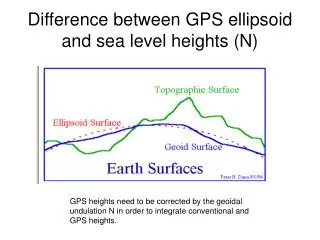
To understand how to achieve GPS-derived orthometric heights at centimeter-level accuracy, three questions must be answered: 1) What types of heights are involved? • Orthometric heights • Ellipsoid heights • Geoid heights 2) How are these heights defined and related? 3) How accurately can these heights be determined?
P Plumb Line PO Mass excess Mass deficiency Ellipsoid, Geoid, and Orthometric Heights “h = H + N” Earth’s Surface Ellipsoid h N Mean Sea “Geoid” Level h (Ellipsoid Height) N (Geoid Height) H (Orthometric Height) Ocean
In Search of the Geoid… Courtesy of Natural Resources Canada www.geod.nrcan.gc.ca/index_e/geodesy_e/geoid03_e.html
Leveled Height Differences B Topography A C
All HeightsBasedonGeopotentialNumber (CP) The geopotential number is the potential energy difference between two points g = local gravity WO = potential at datum (geoid) WP = potential at point • Why use Geopotential Number? - because if the GPN for two • points are equal they are at the same potential and water will • not flow between them
HeightsBasedonGeopotentialNumber (C) • NormalHeight (NGVD 29) H* = C / • = Average normal gravity along plumb line • DynamicHeight (IGLD 55, 85) Hdyn= C / 45 • 45 = Normal gravity at 45° latitude • OrthometricHeight H = C / g • g = Average gravity along the plumb line • HelmertHeight (NAVD 88) H = C / (g + 0.0424 H0) • g = Surface gravity measurement (mgals)
GPS - Derived Ellipsoid Heights Z Axis P (X,Y,Z) = P (,,h) h Earth’s Surface Zero Meridian Reference Ellipsoid Y Axis Mean Equatorial Plane X Axis
EllipsoidHeights (NAD83vs.ITRF 00) • NAD 83: Origin and ellipsoid (GRS-80) • a = 6,378,137.000 meters (semi-major axis) • 1/f = 298.25722210088 (flattening) • ITRF 00: Origin (best estimate of earth’s C.O.M.) • NAD 83 is non-geocentric relative to ITRF 00 origin by 1 - 2 meters • ITRF 00 ellipsoid heights: Use a NAD 83 shaped ellipsoid centered at the ITRF 00 origin • Ellipsoid height differences between NAD 83 and ITRF 00 reflect the non-geocentricity of NAD 83
Simplified Concept of ITRF 00 vs. NAD 83 h83 h00 Earth’s Surface ITRF 00 Origin 2.2 meters NAD 83 Identically shaped ellipsoids (GRS-80) a = 6,378,137.000 meters (semi-major axis) 1/f = 298.25722210088 (flattening) Origin
North American Vertical Datum 1988(NAVD 88) • Defined by one height (Father Point/Rimouski) • Water-level transfers connect leveling across Great Lakes • Adjustment performed in Geopotential Numbers
NGVD 29 Versus NAVD 88 • Datum Considerations:NGVD 29NAVD 88 • Defining Height(s) 26 Local MSL 1 Local MSL • Tidal Epoch Various 1960-78 • (18.6 years) • Treatment of Leveling Data: • Gravity Correction Ortho Correction Geopotential Nos. • (normal gravity) (observed gravity) • Other Corrections Level, Rod, Temp. Level, Rod, Astro, • Temp, Magnetic, • and Refraction • Adjustments Considerations: • Method Least-squares Least-squares • Technique Condition Eq. Observation Eq. • Units of Measure Meters Geopotential Units • Observation Type Links Between Height Differences • Junction Points Between Adjacent BMs
GPS-Derived Ellipsoid HeightGuidelines • Basic concepts • GPS Related Error Sources • NOAA Technical Memorandum NOS NGS-58
San Francisco Bay Demonstration Project R 1393 MOLATE 941 4873 TIDAL 17 BRIONE 941 4863 TIDAL 5 RV 223 CORS PT. BLUNT YACHT 941 4819 TIDAL 32 GPS Site 941 4290 N 0 5 10 941 4779 ASFB PORT 1 KM S 1320 941 4750 TIDAL 7 CHABOT M 554 U 1320 M 148 N 1197 L 1241 WINTON
Two Days/Same Time -10.254 > -10.253 -10.251 Difference = 0.3 cm “Truth” = -10.276 Difference = 2.3 cm Two Days/Different Times -10.254 > -10.275 -10.295 Difference = 4.1 cm “Truth” = -10.276 Difference = 0.1 cm
Precision With CORS • How GPS positioning is affected by baseline length • Varying length baselines formed from 19 CORS • Dual Frequency Geodetic Receivers • Post-Processed with a Precise Orbits • Pairs of CORS sites forming 11 Baselines • Baseline lengths ranging from 26 to 300 km • Various Observation Session Durations (1, 2, 4, 6, 8, 12, and 24 hours)
Recommendations to GuidelinesBased on These Tests • Must repeat base lines • Different days • Different times of day • Detect, remove, reduce effects due to multipath and having almost the same satellite geometry • Must FIX integers • Base lines must have low RMS values, i.e., < 1.5 cm
Available On-Line at the NGS Web Site: www.ngs.noaa.gov
Primary or SecondaryStation Selection Criteria 1. HPGN / HARN either FBN or CBN or CORS • Level ties to A or B stability bench marks during this project 2. Bench marks of A or B stability quality • Or HPGN / HARN previously tied to A or B stability BMs • Special guidelines for areas of subsidence or uplift
Physically Monumented Points Stainless steel rod driven to refusal Poured in place concrete post Disk in outcrop
Four Basic Control Requirements • BCR-1: Occupy stations with known NAVD 88 orthometric heights • Stations should be evenly distributed throughout project • BCR-2: Project areas less than 20 km on a side, surround project with NAVD 88 bench marks • i.e., minimum number of stations is four; one in each corner of project • BCR-3: Project areas greater than 20 km on a side, keep distances between GPS-occupied NAVD 88 bench marks to less than 20 km • BCR-4: Projects located in mountainous regions, occupy bench marks at base and summit of mountains, even if distance is less than 20 km
Equipment Requirements • Dual-frequency, full-wavelength GPS receivers • Required for all observations greater than 10 km • Preferred type for ALL observations regardless of length • Geodetic quality antennas with ground planes • Choke ring antennas; highly recommended • Successfully modeled L1/L2 offsets and phase patterns • Use identical antenna types if possible • Corrections must be utilized by processing software when mixing antenna types
Data Collection Parameters • VDOP < 6 for 90% or longer of 30 minute session • Shorter session lengths stay < 6 always • Schedule travel during periods of higher VDOP • Session lengths > 30 minutes collect 15 second data • Session lengths < 30 minutes collect 5 second data • Track satellites down to 10° elevation angle
Appendix B. - - GPS Ellipsoid Height Hierarchy HARN or CORS Control Stations (75 km) Primary Base (40 km) Secondary Base (15 km) Local Network Stations (7 to 10 km)
Primary Base Stations • Basic Requirements: • 5 Hour Sessions / 3 Days • Spacing between PBS cannot exceed 40 km • Each PBS must be connected to at least its nearest PBS neighbor and nearest control station • PBS must be traceable back to 2 control stations along independent paths; i.e., base lines PB1 - CS1 and PB1 - PB2 plus PB2 - CS2, or PB1 - CS1 and PB1 - PB3 plus PB3 - CS3
Secondary Base Stations • Basic Requirements: • 30 Minute Sessions / 2 Days /Different times of day • Spacing between SBS (or between primary and SBS) cannot exceed 15 km • All base stations (primary and secondary) must be connected to at least its 2 nearest primary or secondary base station neighbors • SBS must be traceable back to 2 PBS along independent paths; i.e., base lines SB1 - PB1 and SB1 - SB3 plus SB3 - PB2, or SB1 - PB1 and SB1 - SB4 plus SB4 - PB3 • SBS need not be established in surveys of small area extent
Local Network Stations • Basic Requirements: • 30 Minute Sessions / 2 Days / Different times of the day • Spacing between LNS (or between base stations and local network stations) cannot exceed 10 km • All LNS must be connected to at least its two nearest neighbors • LNS must be traceable back to 2 primary base stations along independent paths; i.e., base lines LN1 - PB1 and LN1 - LN2 plus LN2 - SB1 plus SB1 - SB3 plus SB3 - PB2, or LN1 - PB1 and LN1 - LN3 plus LN3 - SB2 plus SB2 - SB4 plus SB4 - PB3
Sample Project Showing Connections CS2 CS1 LN4 LN3 LN1 LN2 PB2 PB1 LN5 SB2 SB1 SB3 SB5 SB4 PB4 PB3 CS3 CS4
East Bay Project Points 38°16’N CORS HARN NAVD’88 BM New Station Spacing Station D191 TIDD 10LC X469 Primary Base Station MONT Z190 DROU BM20 Q555 LATITUDE 04KU CATT TOLA TIDE 5144 ZINC 8.2km PT14 R100 P371 04HK LAKE MART 37°55’N 121°40’W 122°20’W LONGITUDE
Primary Base Stations 38°20’N CORS HARN NAVD’88 BM New Station D191 10CC 19.0km Primary Base Station 28.7km 25.7km LATITUDE 38.3km 31.6km 38.7km 25.8km LAKE MART 29.6km MOLA 37°50’N 122°35’W 121°40’W LONGITUDE
Observation Sessions 38°16’N Session F Session E CORS HARN NAVD’88 BM New Station Spacing Station Session D Primary Base Station Session G LATITUDE Session A Session C Session B 37°55’N 121°40’W 122°20’W LONGITUDE
Independent Base Lines 38°16’N F CORS HARN NAVD’88 BM New Station Spacing Station F E F E G D Primary Base Station E F E D LATITUDE D G D G G C B A C A A B 8.2km B A C C B 37°55’N 121°40’W 122°20’W LONGITUDE
Basic Concept of Guidelines • Stations in local 3-dimensional network connected to NSRS to at least 5 cm uncertainty • Stations within a local 3-dimensional network connected to each other to at least 2 cm uncertainty • Stations established following guidelines are published to centimeters by NGS
NSRS benchmarks in Illinois 13,515 benchmarks remain in NGS database 28 % reported as “good” in last 10 years About 50 % are probably still usable
Benchmark availability • There are 3881 Benchmarks in the NGSIDB for Alaska • 663,268 sq mi • Compared to 13,515 for Illinois • 57,918 SQ. MI
CORSNetwork February 2010 ~1445 Stations So far added ~50 (green dots) CORS reprocessing on track. All data back to 1995 re-processed
CORSNetwork February 2010 Another 17 PBO sites will be added next week
Horizontal Velocity Map HTDP Version 3.0 aaaaaaaaaa
Test of Alaska secular field Measurements Freymuller 2008
New Alaska data for HTDP, v 3.0includes dislocation model for the 2002 Denali earthquake Source: Elliott, J. L., Freymueller J. T., and Rabus B. (2007), Coseismic deformation of the 2002 Denali fault earthquake: Contributions from synthetic aperture radar range offsets, J. Geophys. Res., 112, B06421, doi:10.1029/2006JB004428.
Crustal motion in Central Alaska Alaska is subject to tectonic forces Causing horizontal and vertical changes with time The vertical changes particularly are a challenge for height modernization activities in the state Crustal motion data from Freymuller 2009 Uplift data Larsen Pers .Com . 2009