Download

1 / 24
240 likes | 377 Views
Siti Nazahiyah Bte Rahmat Faculty of Civil and Environmental Engineering Universiti Tun Hussein Onn Malaysia (UTHM). URBAN STORMWATER QUALITY AND LOAD ESTIMATION FROM URBAN RESIDENTIAL AREA IN SKUDAI, JOHOR, MALAYSIA. INTRODUCTION. Two main impacts of urbanization.

E N D
Siti Nazahiyah Bte Rahmat Faculty of Civil and Environmental Engineering Universiti Tun Hussein Onn Malaysia (UTHM) URBAN STORMWATER QUALITY AND LOAD ESTIMATION FROM URBAN RESIDENTIAL AREA IN SKUDAI, JOHOR, MALAYSIA
INTRODUCTION • Two main impacts of urbanization. First the hydrology is modified causing more rapid flow path; Second, increase of human activities that adds pollutants. • NPS - need to estimate NPS loads to the receiving watercourses • Crucial for sustainable water resource management
OBJECTIVES Specifically the study will:- • Quantify loadings of pollution from the residential catchment ii. Determine the first flush phenomenon
METHODS • Measurement of rainfall, streamflow and water quality • Analysis of samples for BOD5, COD, SS, Nutrients (NO3-N, NO2-N, NH3-N, P).
STUDY SITE Taman Universiti
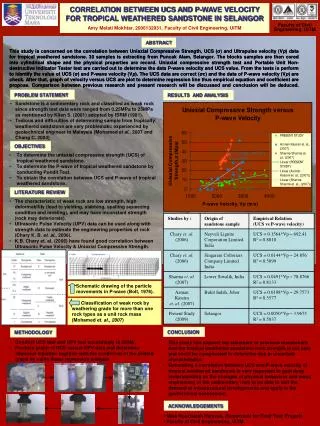
TAMAN UNIVERSITI – JALAN PERTANIAN N Figure 1: Residential catchment Study catchment Catchment outlet N = 1º 32’ 24” E = 103º 37’ 6” Legend Residential area Rain gauge Pervious area Catchment boundary Pavement roads Drainage network Monsoon drain Scale 1 : 4,200
Outlet for the residential catchment Sampling point
Rainfall characteristics of monitored storms Note:* rain gauge was not installed yet
EVENT MEAN CONCENTRATION (EMC) • EMC – total constituent mass discharged, during an event, divided by the total runoff volume of the event. EMC = M = S QiCi / S Qi (1) V Qi is the time -variable flow and Ci is thetime - variable concentration
POLLUTANT LOADING • Calculated by the following equation: L = V x EMC (2) where, L is unit pollutant loading rate (kg/ha), V, total volume of flow over entire event duration (m3) EMC, event mean concentration (mg/l)
FIRST FLUSH PHENOMENON L = m(t) /M (3) F = v(t) / V (4) where L is dimensionless cumulative pollutant mass; m(t) is pollutant mass transport up to time t (g); M is total mass of pollutant over the entire event duration (g); F is dimensionless cumulative runoff volume; v(t) is flow volume up to time t (m3) and V is total volume of flow over the entire event duration (m3).
LITERATURE REVIEW • Bertrand et al. (1998) defined first flush by the fact that at least 80% of the pollutant mass is transported in the first 30% of the volume. • Meanwhile, Wanielista and Yousef (1993) proposed that 50% of the pollutant mass is transported in the first 25% of the volume.
Mass Volume, M(V) ratios of BOD, COD, SS, NO3-N, NO2-N and NH3-N in the residential catchment
Cumulative load at 20-30% of the runoff volume in the residential catchment
CONCLUSION • By comparison to the Interim National Water Quality Standards for Malaysia, the stormwater quality from the urban residential catchment was severely polluted with major parameters generally exceeded the acceptable limits for class V water; • EMC for all parameters were found to vary greatly between storms; • FF phenomena were detected in this study. The relative strength of the first flush was: SS> COD> BOD5> NH3-N> P> NO3-N> NO2-N.
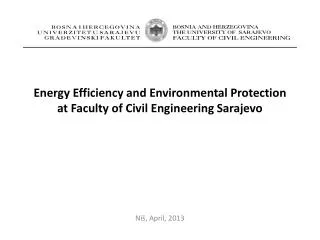
A rain gauge installed on roof top in the residential catchment