Download

1 / 73
730 likes | 863 Views
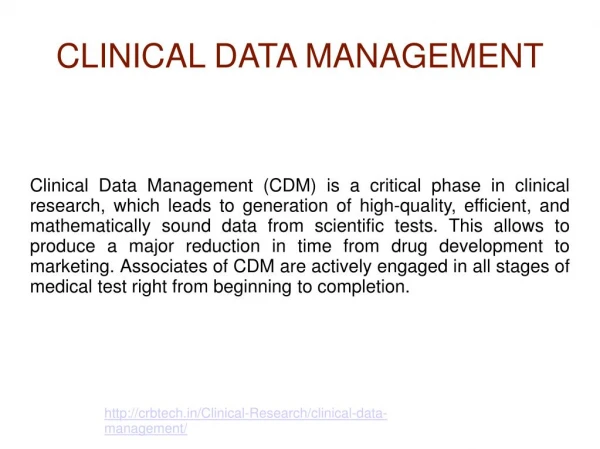
Data Collection and Management for Clinical Research. Michael A. Kohn, MD, MPP 25 August 2008. Clinical Research*. Choose the study design, and define the study population, predictor variables, and outcome variables; measure these variables and anticipate problems with measurement;

E N D
Data Collection and Management for Clinical Research Michael A. Kohn, MD, MPP 25 August 2008
Clinical Research* • Choose the study design, and define the study population, predictor variables, and outcome variables; • measure these variables and anticipate problems with measurement; • analyze the results Today, we discuss the “nitty gritty” of collecting, storing, updating, and monitoring the study measurements. *Private companies that make data management systems for clinical research understand “clinical research” to include only RCTs preparatory to FDA drug or device approval, not observational studies.
Outline • Paper data collection forms and data tables (rows and columns) • “Normalization” of tables • Online data collection forms • Data entry options for coded responses • Questionnaires • Data management protocol • Queries (?)
One-Sentence Description of Study The [cute acronym] study is a [design] study of the association between [predictor] and [outcome] in [study population].
PHTSE The PHTSE (Pre-Hospital Treatment of Status Epilepticus) Study was a randomized blinded trial of lorazepam, diazepam, or placebo in the treatment of pre-hospital status epilepticus. The primary endpoint was termination of convulsions by hospital arrival. To enroll patients, paramedics contacted base hospital physicians by radio. Lowenstein DH, et al. Control Clin Trials. 2001 Jun;22(3):290-309. Alldredge BK, et al. N Engl J Med. 2001 Aug 30;345(9):631-7.
Display the data from these 2 data collection forms in a 2-row data table.
The paper data collection forms were completed by busy base hospital physicians who were called from the emergency department to a radio room. What are the advantages and disadvantages of using an on-screen computer form instead of a paper form? If you designed the study, which would you use?
Advantages of an on-screen form • No need for transcription from paper forms into the computer data tables • Immediate feedback on invalid entries • Programmed skip logic (if seizure stopped during prehospital course, computer form prompts for time seizure stopped, otherwise this field is disabled and skipped) • Can be made available via a web-browser at multiple sites simultaneously
Disadvantages of an on-screen form • Hardware requirement -- a computer workstation • Some user training required
Advantages of a paper form • Ease and speed of use • Portability • Ability to enter unanticipated information or unstructured data (notes in the margin, responses that were not otherwise considered, etc.) • Hardware requirement – a pen • User training received by all data entry personnel in elementary school
Disadvantages of a paper form • Requires subsequent transcription into the computer database • No interactive feedback or automated skip logic • Data viewing and entry limited to one person in one place
Which would you choose? Although data entry via on-screen data collection forms has many advantages and we recommend it for most research studies, in this study it is impractical. The simplest, fastest, and most user-friendly way to capture data on a non-volatile medium is still to use a pen and paper.
Paper Data Collection Forms • Paper forms filled out by an examiner or interviewer • Paper forms filled out by the patient or subject How do you get the data off of the paper forms and into the data table(s)? Study data are stored in one or more data tables in which –
Data Tables Study data are stored in one or more data tables in which – Rows = Records = Entities Columns = Fields = Attributes
Rows = Records = Entities Columns = Fields = Attributes
Jaundice and Infant Feeding Study Cohort study to determine the association between neonatal jaundice or feeding disorders and 5-year neuropsychological scores in children born at Northern California Kaiser Hospitals. Newman TB, et al. N Engl J Med. 2006 May 4;354(18):1889-900.
Infant Jaundice Study (Our fictional version of JIFee) Methods: Design-Double Cohort study. Setting-Single, urban medical center Subjects-Infants with neonatal jaundice and randomly selected non-jaundiced infants Predictor Variable-Presence or absence of jaundice Outcome Variable- IQ score (ranging from 55 to 145) at age 5 years Analysis- ?
Where is the Predictor Field? • What is the predictor in the Infant Jaundice Study? • Where is it on the data collection form?
Demonstration: Creating a Data Table Label columns and enter rows of data in datasheet view
Demonstration: Data Dictionary • Table design view: • field (=column) names, • data types, • definitions, • validation rules • (More on data types, free-text vs. coded responses, later)
Demonstration: Data Validation Disallowed values Duplicate primary keys
Acceptable table showing one set of exam results per participant. (BabyExamForFigure3)
Demonstration: Same Table in Excel, Stata • Excel • Stata • Etc Rows = Records = Entities Columns = Fields = Attributes Access and Stata have a special row at the top for column headings (=field names); Excel just uses the first row.
Table of Study Subjects Table of Study Subjects Row = Individual Infant Columns = ID#, Name, DOB, Sex, Jaundice If some infants have more than one exam, what do you do?
Undesirable table showing multiple exam results per study participant. (BabyExamForFigure4)
Demo • Find highest IQ Score • Find all exams done in April
Common Error • If you find yourself creating multiple columns for the same measurement, e.g., Date1, Score1, Date2, Score2, Date3, Score3, … • Or if your table is more than about 30 columns wide, • It is time to restructure your table.
Undesirable table with participant-specific data duplicated for each exam. (Note problem with Helen’s DOB.) (ExamBabyForFigure5)
Demo • Find highest IQ Score • Find all exams in a particular month • What happened to Alejandro, Ryan, Zachary, and Jackson?
Normalization If some infants have multiple exams, “normalize” the records into two tables, one for subjects and one for examinations.
Data normalized into two tables: one (“Baby”) with rows comprising subject-specific information; the other (“Exam”) with rows comprising exam-specific information. Note that Helen can only have one birth date. Subjects with no exams, e.g. Alejandro, still appear in the database. “SubjectID” functions as the primary key in the “Baby” table and as the foreign key in the “Exam” table.
Figure 7. Relationships diagram showing the one-to-many relationship between the table of subjects (“Baby”) and the table of measurements (“Exam”).
For more on normalization and the “Relational Database Model,” http://www.epibiostat.ucsf.edu/courses/schedule/data_management.html Relational Database Management Systems for Clinical Research, UCSF EPI 218 Winter 2008 (1 unit)
Start with Data Tables or Data Collection Forms? It doesn’t matter as long as the process is iterative. Can start with the tables and then develop the forms, test the forms, find problems, and update the tables. Can start with a word-processed form, create the tables, test, and update.
Before seeking help with data management Search the internet and ask other researchers for already developed data collection forms. Draft your data collection form. Test your data collection form with dummy subjects and, even better, with real (de-identified) study subjects. Enter your test data into a data table with rows corresponding to subjects and columns corresponding to data elements. (Use Excel, Access, Stata, or even Word.) Create or at least think about a data dictionary. Decide who will collect the data, and when/how the data will be collected.
On-Screen Data Collection Forms • Will demonstrate using the “race” field from the Infant Jaundice Study • Free text versus coded response • Single response (mutually exclusive choices) versus “all that apply”
Free Text vs. Coded Responses Same as “Open-Ended” vs. “Closed-Ended” Questions Free text responses useful in developing coded response options.
Mutually Exclusive, Collectively Exhaustive Response Options • One field (=column) • Can always make responses exhaustive by including an “Other” response • Drop down list (combo box) vs. pick list (field list) vs. option group
Drop-down List (Combo Box) • Saves screen real estate • Doesn’t work on paper forms (Master form)
Pick List (Field List) • Uses up screen real estate • Useful on paper forms (MasterRaceAsFieldList form)
Option Group • Radio buttons (by convention) • Uses up screen real estate (MasterRaceAsOptionGroup form)