Download
1 / 27
280 likes | 487 Views
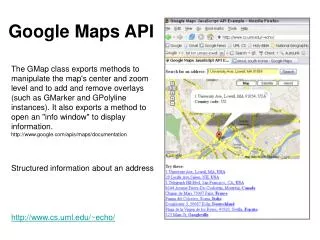
Google Chart - Open API. 2012. 11 Youn-Hee Han LINK@KOREATECH http://link.koreatech.ac.kr. Introduction. Google Chart API Google Chart APIs provide a way to visualize data on your website .

E N D
Google Chart - Open API 2012. 11 Youn-Hee Han LINK@KOREATECH http://link.koreatech.ac.kr
Introduction • Google Chart API • Google Chart APIs provide a way to visualize data on your website. • From simple line charts to complex hierarchical tree maps, the chart galley provides a large number of well-designed chart types. • http://code.google.com/intl/ko-KR/apis/chart/interactive/docs/gallery.html • Charts are exposed as JavaScript classes • Charts are rendered using HTML5 technology to provide cross-browser compatibility and cross platform portability to iPhones, iPads and Android. • No plugins are needed. • Reference Site • Tutorial • http://code.google.com/intl/ko-KR/apis/chart/interactive/docs/index.html • Google Chart API Reference • https://developers.google.com/chart/interactive/docs/reference?hl=ko-KR
Hello Chart! • http://link.koreatech.ac.kr/courses/2012_2/WSC/GChart/HelloChart.html • Loading the Libraries (1/2) • A chart requires three libraries: • The Google JSAPI API • https://developers.google.com/loader/ • The Google Visualization library • The library for the chart itself. <!DOCTYPE html> <html> <head> <meta http-equiv="Content-Type" content="text/html; charset=UTF-8"> <!--Load the AJAX API--> <script type="text/javascript" src="https://www.google.com/jsapi"></script> <script type="text/javascript"> // Load the Visualization API and the piechart package. google.load('visualization', '1.0', {packages:['corechart']}); // Set a callback to run when the Google Visualization API is loaded. google.setOnLoadCallback(drawChart);
Hello Chart! • Loading the Libraries (2/2) • Google Visualization & Chart Library Loading • visualization • Loads the google.visualization library. • This library defines all the core utility classes and functions. • 1.0 • Visualization library version • list_of_package_names • A list of Google chart libraries to load. • The 'corechart' library in the example defines most basic charts, including the pie, bar, and column charts. • For example, here is how to load the core charts plus a table chart: • google.load('visualization', '1.0', {'packages':['corechart','table']}); google.load('visualization', '1.0', {'packages':[<list_of_package_names>]});
Hello Chart! • Register Callback Function • Immediately after calling google.load(), your code should call google.setOnLoadCallback(my_handler), • a function that calls your handler as soon as all the libraries are loaded. • Your handler function should create and define the chart, as described next.
Hello Chart! // Callback that creates and populates a data table, instantiates the pie chart, // passes in the data and draws it. function drawChart() { // Create the data table. var data = new google.visualization.DataTable(); data.addColumn('string', '교과목', '0'); data.addColumn('number', '선호인원', '1'); data.addRows([ ['웹서비스컴퓨팅', 12], ['알고리즘', 8], ['자료구조', 6], ['컴퓨터네트워크', 5], ['운영체제', 1] ]); • Preparing the Data (1/3) • google.visualization.DataTable • a JavaScript class where data to be wrapped • two-dimensional table with rows and columns • each column has a datatype, an optional label, and an optional ID
Hello Chart! • Preparing the Data (2/3) • addColumn(type, opt_label, opt_id) • type - A string with the data type of the values of the column. • 'string‘, 'number‘, 'boolean‘, 'date‘, 'datetime‘, 'timeofday' • opt_label - [Optional] A string with the label of the column. • The column label is typically displayed as part of the visualization • opt_id - [Optional] A string with a unique identifier for the column • If not value is specified, an empty string is assigned • [참고] google.visualization.DataTable 생성할 시에 데이터 넣는 법 var dt = new google.visualization.DataTable( { cols: [{id: 'task', label: 'Task', type: 'string'}, {id: 'hours', label: 'Hours per Day', type: 'number'}], rows: [{c:[{v: 'Work'}, {v: 11}]}, {c:[{v: 'Eat'}, {v: 2}]}, {c:[{v: 'Commute'}, {v: 2}]}, {c:[{v: 'Watch TV'}, {v: 2}]}, {c:[{v: 'Sleep'}, {v: 7}]} ] }, 0.6 The version of the DataTable. The current version is 0.6. )
Hello Chart! • Preparing the Data (3/3) • [참고] google.visualization.arrayToDataTable() 함수 사용 var data = google.visualization.arrayToDataTable([ ['Label', 'Value'], ['Memory', 80], ['CPU', 55], ['Network', 68] ]);
Hello Chart! // Set chart options var options = {'title':'선호 교과목', 'width':800, 'height':600}; • Customizing the Chart • Every chart has many customizable options, including title, colors, line thickness, background fill, and so on • Available option list for Pie Chart • http://code.google.com/intl/ko-KR/apis/chart/interactive/docs/gallery/piechart.html#Configuration_Options • The following object defines the legend position, chart title, chart size, and a 3D option for a Pie Chart var options = { 'legend':'left', 'title':'My Big Pie Chart', 'is3D':true, 'width':800, 'height':600 }
Hello Chart! // Instantiate and draw our chart, passing in some options. var chart = new google.visualization.PieChart(document.getElementById('chart_div')); chart.draw(data, options); } </script> </head> <body> <!--Div that will hold the pie chart--> <div id="chart_div" style="width:800; height:600"></div> </body> </html> • Drawing the Chart • the pie chart is based on the google.visualization.PieChart class • the bar chart is based on the google.visualization.BarChart class • draw() method that takes two values: a DataTable (or a DataView) object that holds your data, and an optional chart options object • draw() method is asynchronous: that is, it returns immediately, but the instance that it returns might not be immediately available
Interacting With the Chart (1/3) • All charts throw some kinds of events. • For example: • select • Thrown when the user click a bar or pie slice on the chart • http://link.koreatech.ac.kr/courses/2012_2/WSC/GChart/ChartEvent1.html var chart; var data; function drawChart() { … data = new google.visualization.DataTable(); … chart = new google.visualization.PieChart(document.getElementById('chart_div')); … google.visualization.events.addListener(chart, 'select', selectHandler); chart.draw(data, options); } function selectHandler() { var selectedItem = chart.getSelection()[0]; var lecture = data.getValue(selectedItem.row, 0); var value = data.getValue(selectedItem.row, 1); alert("The lecture selected is " + lecture + " and the number of the lecture's students is " + value); }
Interacting With the Chart (2/3) • Event Reference • Function getSelection() • https://developers.google.com/chart/interactive/docs/reference?hl=ko-KR#visgetselection • Events • https://developers.google.com/chart/interactive/docs/gallery/barchart?hl=ko-KR#Events
Interacting With the Chart (3/3) • For example: • onmouseover and onmouseout • Thrown when the user mouses over or off of a specific chart element • http://link.koreatech.ac.kr/courses/2012_2/WSC/GChart/ChartEvent2.html • Event Reference • Function setSelection() • https://developers.google.com/chart/interactive/docs/reference?hl=ko-KR#vissetselection … google.visualization.events.addListener(chart, 'onmouseover', mouseOver); chart.draw(data, options); } function mouseOver(e) { chart.setSelection([e]); //alert(e.row + ", " + e.column); }
Chart Drawing Techniques#1: chart.draw() • chart.draw() • the basic method covered in the Hello Chart! Example • Advantages: • You have complete control over every step of the process. • You can register to listen for all events thrown by the chart. • Disadvantages: • Verbose • You must explicitly load all required chart libraries • If you send queries, you must manually implement for the callback, check for success, extract the returned DataTable, and pass it to the chart.
Chart Drawing Techniques#2: ChartWrapper class • ChartWrapper is a convenience class of which advantages are… • Much less code • Pass in the container element ID (containerId), and it will call getElementByID for you. • Data can be submitted in a variety of formats: • an array of values • a JSON literal string • a dataTable handle • Makes querying datasources much easier by creating the Query object and handling the callback for you • Disadvantages • Currently, onmouseover and onmouseout events do not happen
Chart Drawing Techniques#2: ChartWrapper class • Examples • http://link.koreatech.ac.kr/courses/2012_2/WSC/GChart/ChartWrapper.html var wrapper; function drawVisualization() { wrapper = new google.visualization.ChartWrapper({ chartType: 'ColumnChart', dataTable: [['Country', 'USA', 'Brazil', 'Canada', 'France', 'RU'], ['Export (Unit: 1,000,000$)', 300, 400, 500, 600, 800]], options: {title: 'Countries'}, containerId: 'vis_div' }); google.visualization.events.addListener(wrapper, 'ready', onReady); wrapper.draw(); } function onReady() { google.visualization.events.addListener(wrapper.getChart(), 'onmouseover', usefulHandler); } function usefulHandler() { alert("Mouseover event!"); }
Chart Drawing Techniques#2: ChartWrapper class • Examples (Query to Google Spreadsheet) • http://link.koreatech.ac.kr/courses/2012_2/WSC/GChart/DataSource.html var wrapper; function drawVisualization() { wrapper = new google.visualization.ChartWrapper({ chartType: ‘LineChart', dataSourceUrl: 'https://docs.google.com/spreadsheet/ccc?key=0Aq9YWVIHoeE5dG9Bc0d6R05zUU9hbk55RXYtSlg5ZVE&hl=en_US#gid=0', query: 'SELECT A,C WHERE C > 50 ORDER BY C', options: {title: '과목별 점수'}, containerId: 'vis_div' }); wrapper.draw(); }
Chart Drawing Techniques#3: DrawChart() • DrawChart is a global static method that wraps a ChartWrapper. • Advantages: • Same as ChartWrapper, but slightly shorter to use. • Disadvantages: • Does not return a handle to the wrapper, so you cannot handle any events.
Chart Drawing Techniques#3: DrawChart() • Examples • http://link.koreatech.ac.kr/courses/2012_2/WSC/GChart/DataSource2.html function drawVisualization() { google.visualization.drawChart({ chartType: 'Table', dataSourceUrl: 'https://docs.google.com/spreadsheet/ccc?key=0Aq9YWVIHoeE5dG9Bc0d6R05zUU9hbk55RXYtSlg5ZVE&hl=en_US#gid=0', query: 'SELECT A,C WHERE C > 50 ORDER BY C', options: { title: '과목별 점수', alternatingRowStyle: true, showRowNumber : true }, containerId: 'vis_div', refreshInterval: 5 }); }
Customizing Charts • Pie Color • http://link.koreatech.ac.kr/courses/2012_2/WSC/GChart/PieChart.html • 3D Pie Chart • http://link.koreatech.ac.kr/courses/2012_2/WSC/GChart/3DPieChart.html var options = {title: '선호교과목', width: 400, height: 300, colors: ['#e0440e', '#e6693e', '#ec8f6e', '#f3b49f', '#f6c7b6'] }; var options = {title: '선호교과목', width: 400, height: 300, colors: ['#e0440e', '#e6693e', '#ec8f6e', '#f3b49f', '#f6c7b6'], is3D: true };
Guage and Button Event Handling • Guage (각 셀값 별로 별도의 guage 그래프 형성) (1/2) • http://link.koreatech.ac.kr/courses/2012_2/WSC/GChart/Guage.html <!DOCTYPE html> <html> <head> <meta http-equiv="Content-Type" content="text/html; charset=UTF-8"> <script type="text/javascript" src="https://www.google.com/jsapi"></script> <script type="text/javascript"> google.load('visualization', '1.0', {packages:['gauge']}); google.setOnLoadCallback(drawGauge); var gaugeData; var gauge; var gaugeOptions; function drawGauge() { gaugeData = google.visualization.arrayToDataTable([ ['Engine', 'Torpedo'], [120, 80] ]); gauge = new google.visualization.Gauge(document.getElementById('gauge'));
Guage and Button Event Handling gaugeOptions = { min: 0, max: 280, yellowFrom: 200, yellowTo: 250, redFrom: 250, redTo: 280, minorTicks: 5 }; gauge.draw(gaugeData, gaugeOptions); } function changeTemp(dir) { gaugeData.setValue(0, 0, gaugeData.getValue(0, 0) + dir * 25); gaugeData.setValue(0, 1, gaugeData.getValue(0, 1) + dir * 20); gauge.draw(gaugeData, gaugeOptions); } </script> </head> <body> <div id="gauge" style="height: 300px; width: 600px;"></div><br/> <input type="button" value="Go Faster" onclick="changeTemp(1)"/> <input type="button" value="Slow Down" onclick="changeTemp(-1)"/> </body> </html> • Guage (각 셀값 별로 별도의 guage그래프 형성) (2/2)
GeoChart • GeoChart – Country Level (1/2) • It highlights regions or countries based on relative values • Reference: https://developers.google.com/chart/interactive/docs/gallery/geochart • http://link.koreatech.ac.kr/courses/2012_2/WSC/GChart/GeoChart.html <!DOCTYPE html> <html> <head> <meta http-equiv="Content-Type" content="text/html; charset=UTF-8"> <script type="text/javascript" src="https://www.google.com/jsapi"></script> <script type="text/javascript"> google.load('visualization', '1.0', {packages:['geochart']}); google.setOnLoadCallback(drawGeoChart); function drawGeoChart() { var data = google.visualization.arrayToDataTable([ ['Country', 'Popularity'], ['Germany', 200], ['United States', 300], ['Brazil', 400], ['Canada', 500], ['France', 600], ['RU', 700], ['KR', 500] ]);
GeoChart geoChartOptions = { width: 556, height: 347 }; vargeochart = new google.visualization.GeoChart(document.getElementById('geo')); geochart.draw(data, geoChartOptions); } </script> </head> <body style="font-family: Arial;border: 0 none;"> <div id="geo"></div> </body> </html> • GeoChart – Country Level (2/2)
GeoChart • http://link.koreatech.ac.kr/courses/2012_2/WSC/GChart/GeoChart2.html <!DOCTYPE html> <html> <head> <meta http-equiv="Content-Type" content="text/html; charset=UTF-8"> <script type='text/javascript' src='https://www.google.com/jsapi'></script> <script type='text/javascript'> google.load('visualization', '1', {'packages': ['geochart']}); google.setOnLoadCallback(drawMarkersMap); function drawMarkersMap() { var data = google.visualization.arrayToDataTable([ ['City', 'Population'], ['Seoul', 8000000], ['Pusan', 3000000], ['Daejeon', 1500000] ]); var options = { region: 'KR', displayMode: 'markers', colorAxis: {colors: ['green', 'blue']} }; var chart = new google.visualization.GeoChart(document.getElementById('chart_div')); chart.draw(data, options); }; </script> </head> <body> <div id="chart_div" style="width: 900px; height: 500px;"></div> </body> </html> • GeoChart – City Level/Maker display mode
2011년 10월 5일오후 4시 30분 “변리사” 관련 뉴스 리스트 제목: … 내용: … 링크: … 제목: … 내용: … 링크: … … … “변리사” 관련 블로그 리스트 제목: … 내용: … 링크: … 제목: … 내용: … 링크: … … … • 인기 검색어 순위 • 변리사 • 안양외고 • 최강희 • … • … • … • … • … • … • … “변리사” 관련 이미지 리스트 … [실습] • 2차 숙제를 연장하여 각 인기 검색어 별로 ‘뉴스‘, ‘블로그‘, ‘이미지‘ 의 total 개수를 chart 형태로 보여준다. • 샘플 예 오늘의 날씨 천안: 21C…
[실습] • 조건 • 총 3개의 Chart가 한 화면에 보여지되 각 Chart의 종류는 달라야 한다. • 각 Chart에는 실시간 인기 검색어 10개의 bar 또는 pie 등이 있어야 한다. • Chart의 모습이 깔끔하고 전체 페이지와 어울리는지를 신경써야 한다. • [Option 1] • 2차 숙제에서 Chart를 활용하는 아이디어를 더 발굴 하여 위에서 요구하는 3개 외에 다른 Chart를 넣어보도록 한다. • [Option 2] • Chart 내에서 사용자의 Interaction 요소를 넣을 수 있는 아이디어를 발굴하여 구현한다.