Download
1 / 44
440 likes | 590 Views
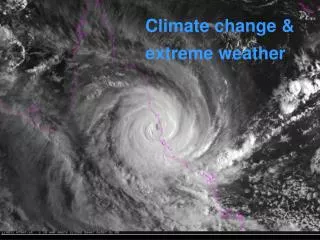
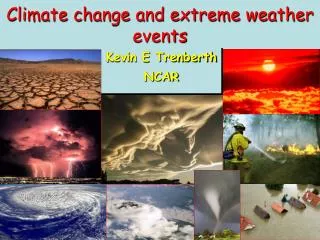
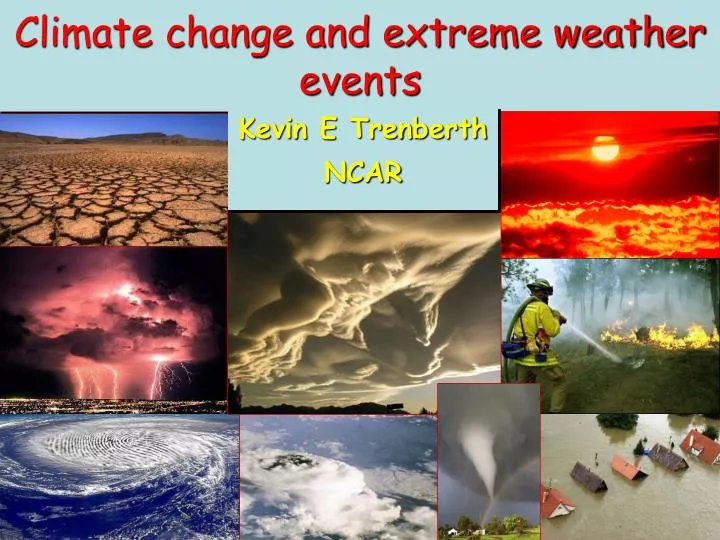
Climate change and extreme weather events. Kevin E Trenberth NCAR. U.S. Annual Tornadoes *2008: preliminary count, may include duplicates; Corrected through February. 2008: 111 deaths 547 May (prelim). adjusted. Climate change and extreme weather events.

E N D
Climate change and extreme weather events Kevin E Trenberth NCAR
U.S. Annual Tornadoes *2008: preliminary count, may include duplicates; Corrected through February 2008: 111 deaths 547 May (prelim) adjusted
Climate change and extreme weather events Changes in extremes matter most for society and the environment • With a warming climate: • More high temperatures, heat waves • Wild fires and other consequences • Fewer cold extremes. • More extremes in hydrological cycle: • Drought, heavy rains, floods • Intense storms
A century of weather-related disasters More in US than any where else Rest of World
Ask the right question! • Is it global warming? • Is it natural variability? These are not the right questions: do not have answers. We can estimate how rare an event was based solely on observations (requires good long data and assumptions of stationary climate) We may be able to state that the odds are remote that the event could have occurred without warming (or without natural variability). Always a combination of both.
Increase in Mean Much bigger percentage changes in extremes
Issues for extremes • Data are “messy” • Often data are not available with right sampling • Spatial scales vary: tornadoes to droughts • Extremes are inherently rare • Terminology: High impact but not really extreme? • Model definitions are often different • Model grid box value may not be comparable to mean of grid box from observations
Estimating extremes in data and models P1: probability of event under current conditions P0: probability of event with external driver removed (requires model) FAR: Fraction of Attributable Risk = 1-P0/P1 Use coupled models to estimate attributable effect Use statistical methods to estimate FAR (e.g. Stott et al 2004) Use GCMs to estimate FAR (e.g. Pall et al 2007) Extend to other regions and variables (e.g. Hoerling et al 2007) Assumes model depicts real world.
Heat waves and wild fires Impacts on human health and mortality, economic impacts, ecosystem and wildlife impacts
Extremes of temperature are changing! Observed trends (days) per decade for 1951 to 2003: 5th or 95th percentiles From Alexander et al. (2006) and IPCC
1979-2003 1951-1978 1901-1950 Warm nights are increasing; cold nights decreasing fewer more fewer more 10th (left) and 90th (right) percentiles Frequency of occurrence of cold or warm temperatures for 202 global stations with at least 80% complete data between 1901 and 2003 for 3 time periods: 1901 to 1950 (black), 1951 to 1978 (blue) and 1979 to 2003 (orange). IPCC
Drought is increasing most places Mainly decrease in rain over land in tropics and subtropics, but enhanced by increased atmospheric demand with warming The most important spatial pattern (top) of the monthly Palmer Drought Severity Index (PDSI) for 1900 to 2002. The time series (below) accounts for most of the trend in PDSI. AR4 IPCC
Increases in rainfall and cloud counter warming Drought Absence of warming by day coincides with wetter and cloudier conditions Trend in Warm Days 1951-2003 IPCC 2007
Trend plus variability? Heat waves are increasing: an example Extreme Heat Wave Summer 2003 Europe 30,000 deaths IPCC AR4
Presence or absence of human influence Change in risk of mean European summer temperatures exceeding 1.6°C above 1961 to 1990 means. Stott et al. 2004 Humans have affected temperatures Summer temperatures in Switzerland from 1864 to 2003. During the extremely hot summer of 2003, average temperatures exceeded 22°C, as indicated by the red bar (a vertical line is shown for each year in the 137-year record). The odds of the 2003 value, given the rest of the record is about 1 in 10 million. IPCC AR4
Modeling southern European JJA temperatures Stott et al 2004
Changing risk of European heat waves The observed heat wave in Europe in 2003 becomes commonplace by 2020s Stott et al 2004
Flooding and extremes of precipitation Photo Dave Mitchell, Courtesy Myles Allen
Role of character of precipitation:Daily Precipitation at 2 stations Monthly Amount 75 mm Amount 75 mm A B Frequency 6.7% Intensity 37.5 mm Frequency 67% Intensity 3.75 mm drought wild fireslocal wilting plantsfloods soil moisture replenished virtually no runoff
Moderate or heavy precipitation: • Can not come from local column. • Can not come from E, unless light precipitation. • Has to come from transport by storm-scale • circulation into storm. • On average, rain producing systems • (e.g., extratropical cyclones; thunderstorms) • reach out and grab moisture from distance about • 3 to 5 times radius of precipitating area.
Observations show that this is happening at the surface and in lower atmosphere: 0.55C since 1970 over global oceans and 4% more water vapor. This means more moisture available for storms and an enhanced greenhouse effect. Total water vapor Air holds more water vapor at higher temperatures A basic physical law tells us that the water holding capacity of the atmosphere goes up at about7% per degree Celsius increase in temperature. (4% per F)
How should precipitation P change as the climate changes? • With increased GHGs: increased surface heating evaporation E and P • With increased aerosols, E and P • Net global effect is small and complex • Warming and T means water vapor as observed • Because precipitation comes from storms gathering up available moisture, rain and snowintensity : widely observed • But this must reduce lifetime and frequency of storms • Longer dry spells Trenberth et al 2003
How should precipitation P change as the climate changes? • “The rich get richer and the poor get poorer”. More water vapor plus moisture transports from divergence regions (subtropics) to convergence zones. Result: wet areas get wetter, dry areas drier (Neelin, Chou) • “Upped ante” precip decreases on edges of convergence zones as it takes more instability to trigger convection: more intense rains and upward motion but broader downward motion. (Neelin, Chou) • “More bang for the buck”: The moisture and energy transport is a physical constraint, and with increased moisture, the winds can be less to achieve the same transport. Hence the divergent circulation weakens. (Soden, Held et al)
Precipitation Observed trends (%) per decade for 1951–2003 contribution to total annual from very wet days > 95th %ile. Alexander et al 2006 IPCC AR4 Heavy precipitation days are increasing even in places where precipitation is decreasing.
Much wetter 1930s: Hot and dry US changes in Precipitation Temperature
PDSI: severe or extreme drought The warmer conditions suggest that drought would have been much worse if it were not for the much wetter conditions. And it would have been much warmer too! Change in area of PDSI in drought using detrended temperature and precipitation: Red is no trend in precipitation: Would be much more drought! Blue is no trend in temperature. Modest warming has contributed Easterling et al 2007
2 mo dry days: SW Warm season duration NV, CA SW SW US Up 5.5 d TX, OK, NM, AZ US Up 4.3% NW Increases in extremes in U.S. Heavy rains: top 0.3% 1 mo dry days: East US up 1.1% up 27% Per 40 years 1967-2006 Groisman, Knight 08
Marked increase after 1994 North Atlantic hurricanes have increased with SSTs N. Atlantic hurricane record best after 1944 with aircraft surveillance. Global number and percentage of intense hurricanes is increasing (1944-2006) SST IPCC
Precip Water Atlantic JASO Linear trends SSTs Higher SSTs and Higher water vapor
JASO Atlantic Higher SSTs and Higher water vapor after 1994 Means more: Ocean evaporation Rainfall, Tropical storms, and Hurricanes
JASO Atlantic Sfc Fluxes 123%/K (total) 90%/K (precip) Precip water SST 7%/K Numbers: TS Hurricanes
Changes across 1994/95JASO:1995-2006 vs 1970-1994 1970-19941995-2006 Diff % Units SSTs 27.5 28.0 0.5 C (10-20N) Wv 33.5 34.9 1.4 4.1/K mm TS 3.4 5.2 1.8 45 No. Hurr 4.5 7.5 3.0 55 Total 7.9 12.7 4.8 43 Sfc Flux 0.41 1.05 0.64 105 1021 J 0.04 0.10 PW Precip 1.36 3.63 2.27 109 1021 J0.13 0.34 PW
Downscaling of hurricanes • Emanuel 2008 BAMS • Knutson et al 2008 Nature Geoscience Use climate models projections of the environmental state • SST • Vertical temperature structure (stability) • Wind shear Hoskins says: "If the large scale is rubbish, then the detail is rubbish, too." --New Scientist, 7 May 2008
Downscaling of hurricanes Knutson et al 2008 Nature Geoscience Good replication of number of tropical storms But no storms cat 2 or higher Why? Models fail to replicate tropical disturbances of all sorts: convective parameterization. Main reason for reduction in Atlantic is wind shear: state more “El Nino-like” Does not apply elsewhere cat 1 cat 2 and above
Some model studies of extremes • Frosts: Meehl et al 2004 • Heat waves: Meehl and Tebaldi 2004 • 2003 European heat wave: Stott et al 2004 • Precipitation, dry days: Tebaldi et al 2007 • Many indices Frich et al. 2002 defined 10 standard extremes indices derived from observed data, then from 9 CMIP3 models for AR4 • Precip: Meehl et al 2005
Extremes indices for temperature • Total number of frost days, defined as the annual total number of days with absolute minimum temperature below 0⁰C • Intra-annual extreme temperature range, defined as the difference between the highest temperature of the year and the lowest • Growing season length, defined as the length of the period between the first spell of five consecutive days with mean temperature above 5⁰C and the last such spell of the year • Heat wave duration index, defined as the maximum period of at least 5 consecutive days with maximum temperature higher by at least 5⁰C than the climatological norm for the same calendar day • Warm nights, defined as the percentage of times in the year when minimum temperature is above the 90th percentile of the climatological distribution for that calendar day Frich et al 2002 Clim. Res.
Extremes indices for precipitation • Number of days with precipitation greater than 10mm • Maximum number of consecutive dry days • Maximum 5-day precipitation total • Simple daily intensity index, defined as the annual total precipitation divided by the number of wet days • Fraction of total precipitation due to events exceeding the 95th percentile of the climatological distribution for wet day amounts Frich et al 2002 Clim. Res.
Combined effects of increased precipitation intensity and more dry days contribute to mean precipitation changes
(Tebaldi , C., J.M. Arblaster, K. Hayhoe, and G.A. Meehl, 2006: Going to the extremes: An intercomparison of model-simulated historical and future changes in extreme events. Clim. Change.)