Download
1 / 28
290 likes | 534 Views
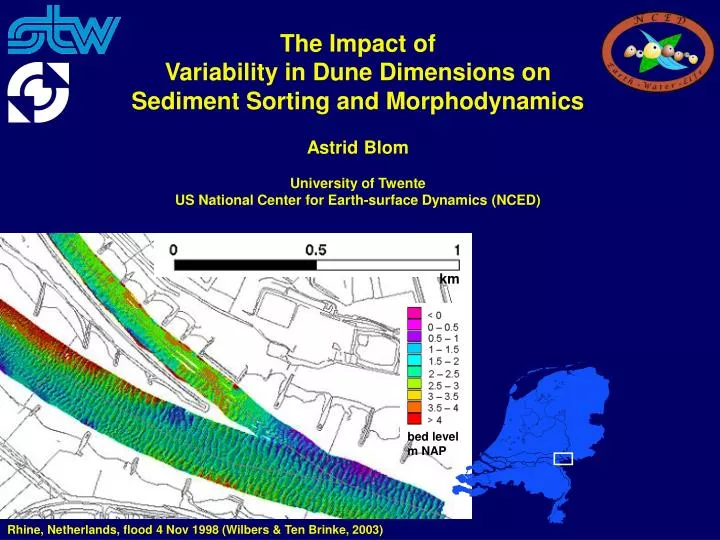
km. bed level m NAP. The Impact of Variability in Dune Dimensions on Sediment Sorting and Morphodynamics Astrid Blom University of Twente US National Center for Earth-surface Dynamics (NCED). Rhine, Netherlands, flood 4 Nov 1998 (Wilbers & Ten Brinke, 2003). Blom et al., WRR, 2003.

E N D
km bed level m NAP The Impact ofVariability in Dune Dimensions onSediment Sorting and MorphodynamicsAstrid BlomUniversity of Twente US National Center for Earth-surface Dynamics (NCED) Rhine, Netherlands, flood 4 Nov 1998 (Wilbers & Ten Brinke, 2003)
Continuity of non-uniform sediment Existing bed layer models (e.g., Hirano, 1971) • Useful, but… • Inadequate description of sediment fluxes • Ellipticity of set of equations • Problematic definition of active layer Developments • Sediment continuity framework by Parker, Paola & Leclair (2000): active bed described by PDF of bed surface elevations • Extension to dunes (Blom, 2003, Blom & Parker, 2004) • Present research: extension to aggradational / degradational cases
Case study The Ribberink (1987) aggradation experiment Three sediment continuity models: • The Hirano active layer model • The sorting evolution model with regular dunes • The sorting evolution model with irregular dunes • Flow described using formulation backwater curve • Simple power-based and surface-based sub-model ofsediment transport (Ribberink, 1987)
The Hirano active layer model (1971) Faiqa Fmi active layer ηI FIi substrate Sediment continuity of active layer: cb sediment concentration within the bed (cb= 1 - porosity) Fmi volume fraction content of size fraction i in the active layer Fai volume fraction content of size fraction i in the transported sediment FIi volume fraction content of size fraction i at the interface qa sediment transport rate thickness of active layer ηI elevation of interface between active layer and substrate
z z z coarse ha fine Fi Ps x The sorting evolution model (Blom, 2003) based on Parker-Paola-Leclair (2000) framework Ci concentration of size fraction i at level z (Ci= cb Ps Fi) Ps probability that the bed level is higher than z Fi volume fraction content of size fraction i at level z Dei Eei deposition and entrainment densities of size fraction i at level z cb sediment concentration within the bed (cb= 1 - porosity)
qtop stoss lee z x The sorting evolution model Sediment fluxes through dune migration • Only bed load transport. • Apply the Einstein step length formulation (Einstein, 1950) to the stoss face: deterministic step lengths • At the lee face entrainment neglected. Lee face deposition determined by alee sorting function.
The sorting evolution model Sediment fluxes through dune migration variability in bedform dimensions (Leclair, 2002) e.g. E(z) = Estoss(z) pb dηb
The sorting evolution model Sediment fluxes through net aggradation / degradation • distributed over depth according to exposure to flow • composition of fluxes uniform over bed elevations
The Ribberink aggradation experiment • Experiment E8-E9 by Ribberink (1987) • 2 sand fractions (0.78 mm, 1.29 mm) • Dunes • Start from exp E8 • Over 30h, feed of fines was decreased to 0 • Total feed rate was maintained steady
Active part of the bed • Mean dune height and PDF troughs assumed steady • Hydraulic roughness assumed steady (Ribberink, 1987) • Mean dune height = 3cm • Active layer thickness = 1/2
Results: Composition of bed load transportat downstream end of flume
Discussion and conclusions • Note: no parameter tuning • Taking into account the variability in dune dimensions • allows sediment to be ‘stored’ at lower elevations • improves the predicted adaptation time scales • improves the predicted sorting profile • Reduction to a simplified model • Applicable to alternate bars? (data Lanzoni, Miwa) • Model PDF trough elevations (Van der Mark et al., 2005) • New flume experiments at VTCHL
The research project is supported by: The Netherlands Organization for Scientific Research (NWO-STW) University of Twente (Civil Engineering) US National Center for Earth-surface Dynamics (NCED) The following persons have contributed to the work through discussion: Gary Parker, Jan Ribberink, Maarten Kleinhans, Suzanne Hulscher, Suzanne Leclair, Bert Jagers, Kees Sloff, Rolien van der Mark, and David Mohrig.
qtop stoss lee z x The sorting evolution model (Blom, 2003) • Only bed load transport. • Apply the Einstein step length formulation (Einstein, 1950) to the stoss face: deterministic step lengths • At the lee face neglect entrainment. Lee face deposition determined by anewly-developed lee sorting function i.
z mean grain size little coarser than mean grain size coarse proportion ofsize fraction Lee sorting function i