Download

1 / 25
250 likes | 334 Views
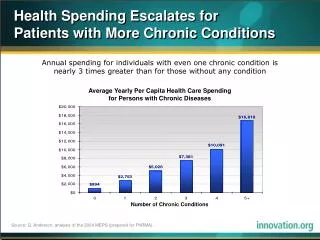
Patterns of Quality for Patients with Three Chronic Conditions. Stephen M. Davidson, Ph.D. Michael Shwartz, Ph.D. Randall S.Stafford, M.D. Academy of Health Services Research and Health Policy San Diego, CA June 7, 2004.

E N D
Patterns of Quality for Patients with Three Chronic Conditions Stephen M. Davidson, Ph.D. Michael Shwartz, Ph.D. Randall S.Stafford, M.D. Academy of Health Services Research and Health Policy San Diego, CA June 7, 2004
It is widely accepted that quality of care is suboptimal and unreliable • Wide variation in HEDIS measures • Deficits in condition-specific patterns of care • IOM reports • Large numbers of published stories of errors
Although uncertain safety and quality of health care are serious and pervasive problems, the actual extent to which inadequate care is found in the U.S. is unknown. One reason: difficulty of measurement.
Three Main Goals • Describe new claims-based measures showing 5 levels of quality for each of 3 chronic conditions. • Report the extent to which each of those levels is present among insured patients in a single market. • Compare patterns of care by type of insurance.
Data • 4 years of claims data covering 1994-1997 in a single market. • Patients covered by 5 different insurance plans: • 1 private indemnity plan • 2 private managed care plans • Medicare risk plan • Medicare indemnity plan
Claims from the 5 plans were merged in a single dataset. • Data on a final sample of 80,000 patients with 1 of 3 chronic conditions: • Asthma • Diabetes • Congestive Heart Failure (CHF).
Assumptions • For each condition, an optimal pattern of care for most patients exists. • Patients may obtain some, but not all of the recommended services. Therefore, several different grades of quality can be described.
Example: Diabetes 5 components of good quality care: • Having an outpatient visit during the year. • Receiving an HbA1c test during the year. • Having continuity in hypoglycemic medications for more than 6 months. • Avoiding an ER visit or a diabetes-related hospitalization.
Receive 3 or more of the following: • Flu shot, • Podiatry visit, • Ophthalmology visit, or • Microalbumin test or on ARB or ACE Inhibitor.
5 Levels of Quality • Neglected care • Suboptimal care • Basic care • Better care • Best care
OutpatientVisit Yes No HbA1c Test HbA1c Test Yes No Yes No ER Visit or Hosp. Admit No Yes Prescription Continuity Prescription Continuity Prescription Continuity No Yes No Yes Yes No FPOA* FPOA* FPOA* 3+ <3 3+ <3 3+ <3 Neglected Basic Better Suboptimal Best *F=Flu Shot; P=Podiatry Visit; O=Ophthalmology Visit; A = microalbumin test or ARB or ACE inhibitor
The Study Group • All patients with one of three chronic conditions in previous year. • Claims on at least two dates of service. • New to coverage in 1994. • Covered in all years, 1994 through 1997. • Data presented on calendar year basis.
Many patients were in the lowest categories: • For diabetes and CHF, 59% to 71% were in lowest categories, • For asthma patients, about 40% were in lowest categories.
Too few patients were in the highest categories: • Only for asthma were more than half of patients in the top two categories. • Fewer than 16% of patients in the other 2 categories were in the top two categories.
Trends In most cases, having started out in a category, patients continued in that category from one year to the next.
Insurance Type In every year and for all three diagnoses, indemnity patients were much more likely to be in the lowest categories, and managed care patients were much more likely to be in the highest categories.
Limitations • Administrative data – not a full picture of the clinical phenomenon of quality care. • For indemnity patients, some utilization may be missing from the dataset. • Claims may under-report services actually used. • Data were from a single market. May not generalize to U.S.
Discussion • Large proportions of patients had utilization patterns that failed to meet quality criteria. • Patterns tended to persist from year to year.
Patients with Indemnity Insurance 3. Patients with indemnity insurance were much less likely to meet quality standards than patients in managed care. • Cost sharing is an obstacle to achieving optimal patterns of care. • Cost sharing reduces demand and, therefore, expenditures, but does not discriminate between needed and frivolous care.
Patients with Managed Care Coverage • For managed care patients, the numbers with appropriate patterns of care are too low, as well. • It is fair to say that MCOs and their physicians are not maximizing their opportunity to create optimal patterns of care.
The Challenge Find methods to avoid unnecessary utilization while increasing, not reducing, the numbers with quality of care. Use the advantages of managed care to increase the numbers of patients with appropriate patterns of care.