Download
1 / 6
70 likes | 285 Views
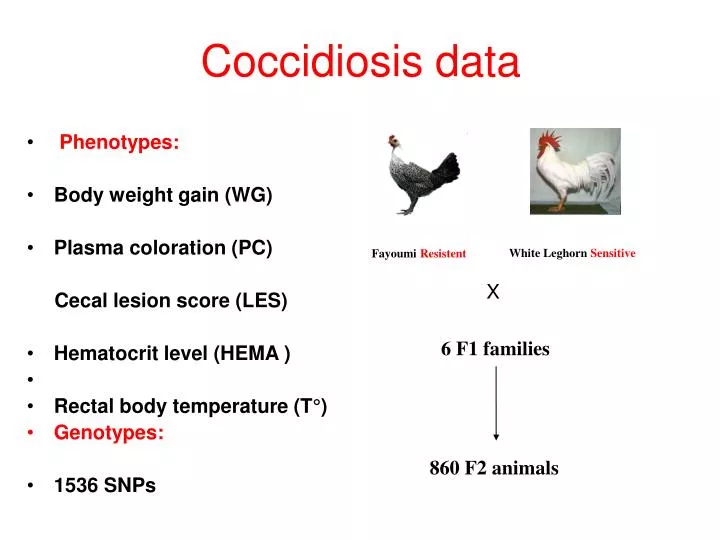
Coccidiosis data. Phenotypes: Body weight gain (WG) Plasma coloration (PC) Cecal lesion score (LES) Hematocrit level (HEMA ) Rectal body temperature (T°) Genotypes: 1536 SNPs. Fayoumi Resistent. White Leghorn Sensitive. X. 6 F1 families. 860 F2 animals.

E N D
Coccidiosis data • Phenotypes: • Body weight gain (WG) • Plasma coloration (PC) Cecal lesion score (LES) • Hematocrit level (HEMA ) • Rectal body temperature (T°) • Genotypes: • 1536 SNPs Fayoumi Resistent White Leghorn Sensitive X 6 F1 families 860 F2 animals
Preliminar epistasis analysis • Phenotype: HEMATOCRIT level (%). • Genotypes corrected for mendelian errors • Data adjusted for sex and hatch effect • VCE estimation using GS3 • Including SNP as random, normal effects
Choice of SNP of reference • Training data: 2 genotype groups (11 and 22) with 150 animals by group at least for each SNP • Additive values estimation for all SNPs in each group ( 2 values for each SNP) • Estimate GEBVs for “12” animals (test set) through BLUP method by using SNP additive values estimated earlier • Minimal GEBVs correlation used as criteria to pick out the SNP of reference
Checking on minimal BLUP correlation • 1000 simulations under the H0 • 600 random animals splitted into 2 random groups • The actual R for topList SNP of reference was - 0.31
Picking interacting SNPs • 2 genotype groups (11 and 22) for the SNP of reference • SNP additive values estimation (BAYESCPi method) for both groups • Plot of estimated values
How to select interacting SNPs? • Using pi value to get rid of SNP with no effect • Different correlation values as threshold • Others?