Download
1 / 13
180 likes | 385 Views
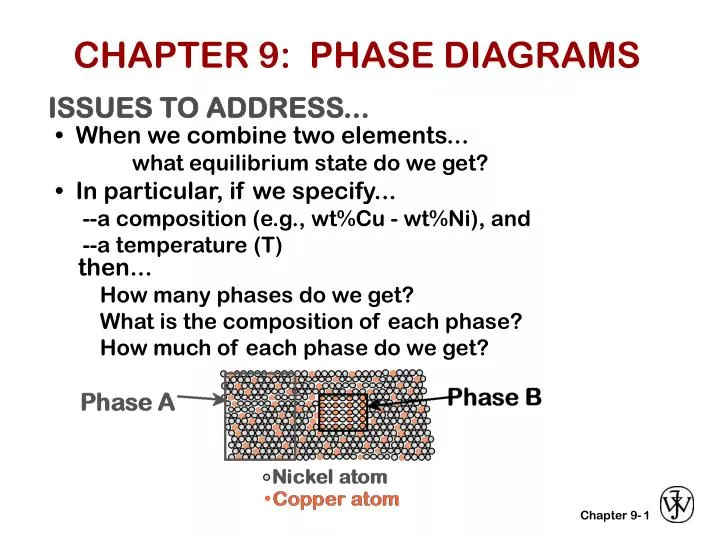
CHAPTER 9: PHASE DIAGRAMS. ISSUES TO ADDRESS. • When we combine two elements... what equilibrium state do we get?. • In particular, if we specify... --a composition (e.g., wt%Cu - wt%Ni), and --a temperature (T). then... How many phases do we get?

E N D
CHAPTER 9: PHASE DIAGRAMS ISSUES TO ADDRESS... • When we combine two elements... what equilibrium state do we get? • In particular, if we specify... --a composition (e.g., wt%Cu - wt%Ni), and --a temperature (T) then... How many phases do we get? What is the composition of each phase? How much of each phase do we get? 1
THE SOLUBILITY LIMIT • Solubility Limit: Max concentration for which only a solution occurs. • Ex: Phase Diagram: Water-Sugar System Question: What is the solubility limit at 20C? Answer: 65wt% sugar. If Co < 65wt% sugar: syrup If Co > 65wt% sugar: syrup + sugar. Adapted from Fig. 9.1, Callister 6e. • Solubility limit increases with T: e.g., if T = 100C, solubility limit = 80wt% sugar. 2
COMPONENTS AND PHASES • Components: The elements or compounds which are mixed initially (e.g., Al and Cu) • Phases: The physically and chemically distinct material regions that result (e.g., a and b). Aluminum- Copper Alloy Adapted from Fig. 9.0, Callister 3e. 3 3
EFFECT OF T & COMPOSITION (Co) • Changing T can change # of phases: path A to B. • Changing Co can change # of phases: path B to D. • water- sugar system Adapted from Fig. 9.1, Callister 6e. 4
PHASE DIAGRAMS • Tell us about phases as function of T, Co, P. • For this course: --binary systems: just 2 components. --independent variables: T and Co (P = 1atm is always used). • Phase Diagram for Cu-Ni system Adapted from Fig. 9.2(a), Callister 6e. (Fig. 9.2(a) is adapted from Phase Diagrams of Binary Nickel Alloys, P. Nash (Ed.), ASM International, Materials Park, OH (1991). 5
PHASE DIAGRAMS:# and types of phases • Rule 1: If we know T and Co, then we know: --the # and types of phases present. • Examples: Cu-Ni phase diagram Adapted from Fig. 9.2(a), Callister 6e. (Fig. 9.2(a) is adapted from Phase Diagrams of Binary Nickel Alloys, P. Nash (Ed.), ASM International, Materials Park, OH, 1991). 6
PHASE DIAGRAMS: composition of phases • Rule 2: If we know T and Co, then we know: --the composition of each phase. Cu-Ni system • Examples: Adapted from Fig. 9.2(b), Callister 6e. (Fig. 9.2(b) is adapted from Phase Diagrams of Binary Nickel Alloys, P. Nash (Ed.), ASM International, Materials Park, OH, 1991.) 7
PHASE DIAGRAMS: weight fractions of phases • Rule 3: If we know T and Co, then we know: --the amount of each phase (given in wt%). Cu-Ni system • Examples: = 27wt% Adapted from Fig. 9.2(b), Callister 6e. (Fig. 9.2(b) is adapted from Phase Diagrams of Binary Nickel Alloys, P. Nash (Ed.), ASM International, Materials Park, OH, 1991.) 8
THE LEVER RULE: A PROOF • Sum of weight fractions: • Conservation of mass (Ni): • Combine above equations: • A geometric interpretation: 9
EX: COOLING IN A Cu-Ni BINARY • Phase diagram: Cu-Ni system. Cu-Ni system • System is: --binary i.e., 2 components: Cu and Ni. --isomorphous i.e., complete solubility of one component in another; a phase field extends from 0 to 100wt% Ni. • Consider Co = 35wt%Ni. Adapted from Fig. 9.3, Callister 6e. 10
CORED VS EQUILIBRIUM PHASES • Ca changes as we solidify. • Cu-Ni case: First a to solidify has Ca = 46wt%Ni. Last a to solidify has Ca = 35wt%Ni. • Fast rate of cooling: Cored structure • Slow rate of cooling: Equilibrium structure 11
MECHANICAL PROPERTIES:Cu-Ni System • Effect of solid solution strengthening on: --Tensile strength (TS) --Ductility (%EL,%AR) Adapted from Fig. 9.5(a), Callister 6e. Adapted from Fig. 9.5(b), Callister 6e. --Peak as a function of Co --Min. as a function of Co 12
BINARY-EUTECTIC SYSTEMS has a special composition with a min. melting T. 2 components Cu-Ag system Ag Adapted from Fig. 9.6, Callister 6e. (Fig. 9.6 adapted from Binary Phase Diagrams, 2nd ed., Vol. 1, T.B. Massalski (Editor-in-Chief), ASM International, Materials Park, OH, 1990.) 13