Download
1 / 54
540 likes | 695 Views
Chapter 5 and 6 Organic and Inorganic Chemical Analysis. Phase Changes : (physical state changes) Melting: from solid directly into liquid Freezing : from liquid directly into solid Vaporization: from liquid directly into gas Condensation: from gas directly into liquid

E N D
Chapter 5 and 6 Organic and Inorganic Chemical Analysis
Phase Changes: (physical state changes) • Melting: from solid directly into liquid • Freezing: from liquid directly into solid • Vaporization: from liquid directly into gas • Condensation:from gas directly into liquid • Sublimation:from solid directly into gas • Deposition:from gas directly intosolid
Matter Can be separated by physical methods No Yes Pure Substance Uniform Composition? Can it be broken down further ? Yes No Yes No Compound Element Homogeneous (solution) Heterogeneous Mixture
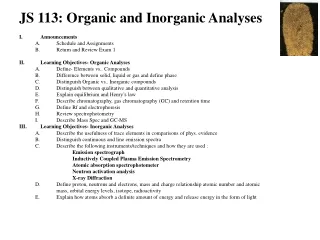
Selecting an Analytical Technique • Organic: a substance composed of carbon(often contain hydrogen and smaller amounts of oxygen, nitrogen, chlorine, or phosphorus) • Inorganic:a chemical compound not based on carbon
Questions to consider in choosing ananalytical (chemical) method: • Quantitative or qualitative required • Sample size and sample preparationrequirements • What level of analysis is required (ex. ± 1.0% or ± 0.001%) • Detection levels • Destructive or non-destructive • Availability of instrumentation • Admissibility
What Is Chromatography? • Laboratory technique for separating mixtures into their component compounds • Uses some version of a technique in which two phases (one mobile, one stationary) flow past one another
Chromatography Review • Chromatographic systems have a stationary phaseand a mobile phase (usually liquid or gas) • The mixture to be separated is placed on the stationary phase • The mobile phase then “pushes” the components of the mixture through the system • Each component adsorbs on the stationary phase with a different strength (stronger means moves more slowly through the system) • Each component comes out the end of the system at a different time (retention time) • When the molecules reach the far end of the surface, they are detected or measured one at a time as they emerge
Chromatography is non-destructive • Separation of components depends on both their solubility in the mobile phase and their differential affinity to the stationary phase.
Street Drugs in Real Time Amphetamine Methamphetamine and MDMA Hydrocodone Cocaine Oxycodone
Types of Chromatography • Paper Chromatography • Thin-Layer Chromatography (TLC) • Liquid Chromatography (HPLC) • Gas Chromatography (GC)
Paper Chromatography • Stationary phase • a sheet or strip of paper • mobile phase • a liquid solvent • Sample mixture spotted onto the paper • Capillary action moves mobile phase • Components appear as separate spots spread out on the paper after drying
Thin Layer Chromatography (TLC) • Stationary Phase • a thin layer of adsorbent coating on a sheet of plastic or glass • Mobile Phase • a liquid solvent • Sample mixture spotted onto the adsorbent • - Solids must first be dissolved • - Liquids can be directly applied • Some components bind to the adsorbent strongly; some weakly • Components appear as separate spots after development
Retention Factor (Rf) • An indication of how far a compound travels in a particular solvent • Good gauge of whether an unknown and a known compound are similar • Rf= distance the solute (D1) moves divided by the distance traveled by the solvent front (D2) • Rf= D1 • D2
Gas Chromatography • Stationary phase • a solid or very “syrupy” liquid in a tube (column) • Mobile phase • an inert gas (carrier gas) • Usually nitrogen or helium
Analysis Using the GC • Retention time can be used as an identifying characteristic of a substance • retention times may not be unique • An extremely sensitive technique • area under a peak is proportional to the quantity of substance present • allows quantitation of sample • Retention time: time between when the sample is injected and when it exits the column reaching the detector
Retention Time Tmis the time it takes for the mobile phase to pass through the column
High Performance Liquid Chromatography (HPLC) • Stationary phase • fine solid particles which are chemically treated • Mobile phase • a liquid • Advantage: takes place at room temperature • Used for organic explosives that are heat sensitive as well as heat sensitive drugs
Mass Scale Atomic and Molecular Weights • Atomic Mass Scale - based upon 12C isotope. This isotope is assigned a mass of exactly 12 atomic mass units (amu) and the masses of all other atoms are given relative to this standard. • Most elements in nature exist as mixtures of isotopes (atoms of an element that have different numbers of neutrons but same number of protons).
Mass Spectrometry (MS or mass spec) Basic Ideas Creates charged particles (ions) from gas phase molecules. The Mass Spec analyzes ions to provide information about the molecular weight of the compound and its chemical structure.
Mass Spectrometer (MS) • As the sample leaves the GC or HPLC, it enters the Mass spec. • Within the MS, a beam of electrons is shot at the substance breaking it down into fragments • These fragments pass through an electric field which separates them by their masses • The fragment masses are then recorded • Each substance breaks down into its own characteristic pattern
Mass Spectrometer Atomic Spectra Mass Spectrum Mass Spectrum Mass Spectrum Int. Int. Int. P Cl C 35 31 12 37 13 mass number (amu) mass number (amu) mass number (amu) 31P: 100% abundant 35Cl: 75% abundant 37Cl: 24% abundant 12Cl: 98.9% abundant 13Cl: 1.11% abundant
The unique feature of mass spectrometry is that under carefully controlled conditions, no two substances produce the same fragmentation pattern • Allows for identifying chemical substance • Each mass spectrum is unique to each drug and so serves as specific test for identifying the substance
Mass Spectrometer Unknown white powdery substance ingested by unconscious patient. What do you do? Is it Heroin, Cocaine, Caffeine? Mass Spectrum of Unknown Compound
Mass Spectrometer MS Library Heroin MS of Unknown
Mass Spectrometer Cocaine MS Library MS of Unknown
Mass Spectrometer MS Library Caffeine MS of Unknown
Mass Spectrometer Unknown white powdery substance ingested by unconscious patient. What do you do? Mol. Wgt = 194 Mass Spectrum Caffeine
Electrophoresis • Separates materials based on their migration rates on a stationary solid phase • Passes an electrical current through the medium and allows for classification of proteins (DNA)
Most useful applications ofElectrophoresis • Characterization of proteins and DNA in dried blood • Proteins migrate at speeds that vary according to their electrical charge and size resulting in characteristic band patterns
Spectroscopy and Spectrophotometry • Study of absorption of light by chemical substances • Used for identification of various organic materials or for presence of trace elements • Electromagnetic spectrum – entire range of “light waves” • Colors – absorption or reflection of various wavelengths of visible light • Ultraviolet or infrared radiation (either side of visible region) • X-ray – high energy, short wavelength
Incoherent light – light comprised of waves that are out of step with each other
Coherent or laser light – light whose waves are pulsating in unison • Laser (light amplification by the simulated emission of radiation)
Photon – small packet of electromagnetic radiation energy. • Each photon contains a unit of energy • E = hν • E = energy of photon • ν= frequency of radiation • h = Plank’s constant (6.626 X 10⁻³⁴ J•s)
The Spectrophotometer • Instrument used to measure and record the absorption spectrum of a chemical substance
UV Spectrophotometry • Measuresabsorbance of UV and visible light as a function of wavelength or frequency • Allows tentative identification • Ex. White powder with UV spectrum comparable to that of heroin results in a tentative identification
Infrared Spectrophotometry • Different materials always have distinctively different infrared spectra • Each IR spectrum is therefore equivalent to a “fingerprint” of that substance and no other • Extensive catalogue of IR spectra of organic compounds allows for identification of organic substances
Atomic Emission Spectroscopy (AES) • Used to detect the types of elements present in a sample • Can use measurement of the emissions from excited atoms to determine concentration. • Frequency of light given off The Hydrogen Discharge Tube • H2molecules are excited by an electric discharge • As the atoms return to lower energy states, light is emitted
Flame Tests Atomic Emission
Atomic Absorption Spectroscopy (AAS) • Sample heated and atoms absorb radiation • Atoms become excited • The amount of radiation absorbed is recorded • Can be used to quantitate amounts based on a calibration curve • Beer’s Law (Absorption is proportional to concentration)
Example: • Determination of the wavelength of lightabsorbed by a sample of grape soda Absorption of Grape Soda
Example: • Determination of the amount of dilution of a sample of grape soda