Download
1 / 32
320 likes | 453 Views
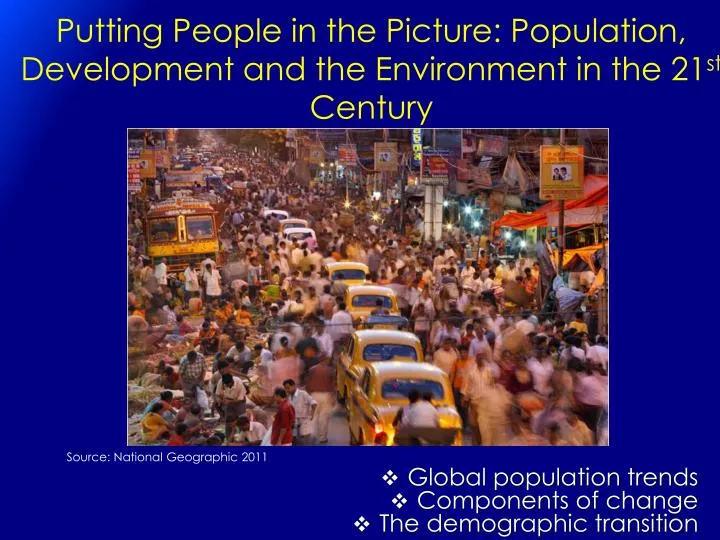
Putting People in the Picture: Population, Development and the Environment in the 21 st Century. Source: National Geographic 2011. Global population trends Components of change The demographic transition. Lecture learning objectives.

E N D
Putting People in the Picture: Population, Development and the Environment in the 21st Century Source: National Geographic 2011 • Global population trends • Components of change • The demographic transition
Lecture learning objectives • Appreciate the scale and dimensions of global population growth • Explore the links between population, the environment and development
Population growth through history • For most of human history, global population did not exceed 10 million BC AD 1804: 1 billion 1927: 2 billion (123 years later) 1959: 3 billion (32 years later) 1974: 4 billion (15 years later) 1987: 5 billion (13 years later) 1998: 6 billion (11 years later) 2011: 7 billion (13 years later)
Current world population increase • On 31/10/2012 the world’s population reached 7 billion • It is currently growing at around 2.5 people per second • 78 million people per year During this lecture 15,206 babies will be born and 6,335 people will die. The global population will increase by 8,871.
How many people were alive when you were born? http://www.ined.fr/en/everything_about_population/world_population_me/
Continuing but slowing growth • Nearly all growth - 97 of every 100 people - is occurring in LDCs
Demographic Components of Change Pt+n = Pt + (B – D) {+ (I – O)} Where Pt+n is population at time t plus n years Pt is population at time t B is births occurring between t and t+n D is deaths occurring between t and t+n I represents gains from immigration O represents losses through emigration
WORLD MDCs LDCs
Why did global population growth explode in the 20th Century? • Why is the rate of global population growth decreasing? • When/if will global population stabilise?
The demographic transition model Describes the transition from traditional societies in which birth and death rates are high but in balance, through epochs of rapid population growth, to the situation characteristic of modern, industrial societies where fertility and mortality come back into equilibrium at new low levels • Descriptive device - empirical observations of actual countries • Explanatory theory - attempts to explain why changes occur as they do • Predictive model - allows timing of transition to be predicted See e.g. Thompson 1927, Notestein 1945, Dyson 2012
The demographic transition model Mortality decline Population growth Fertility decline Urbanisation Ageing Transition from a young, rural, fluctuating population through a period of rapid growth towards an old, urban population that is stable or in decline Associated Transitions Mobility Occupational Educational Political Gender equity After Dyson 2012
Testing the DTM… • www.bit.ly/1snrk8x • www.bit.ly/1nk5t2c • www.bit.ly/1nk6ozE
Thailand Australia Niger Italy
The end of world population growth… Source: United Nations, Department of Economic and Social Affairs, Population Division (2011): World Population Prospects: The 2012 Revision. New York
Bifurcation into Two Global Demographic Categories • Low growth countries with rapid ageing • Italy 57 million 41 million (-28%) 33.3% 65+; median age 52.5 • Japan 127 million 105 (-17%) 37.8% 65+; median age 52.3 • High growth countries with high fertility and low proportions of older people • India 1.03 billion 1,63 billion (+58%) (13.7% 65+); • Nigeria 158 illion 289 (+82%) (6.2% 65+)
More Developed Countries • MDCs • Population ageing • LDCs • Youth bulge (young age structure) • Demographic dividend (Transitional age structure) Less Developed Countries
Per cent Urban Population: More and Less Developed Regions Key Facts • Mid 2009, no. of people in urban areas (3.42 billion) had surpassed no. of people in rural areas (3.4.1 billion) • By 2050 this will rise to 6.29 billion – absorbing the entire world’s population growth of 2.32 billion people Key Facts • MDCs (74.9%) are more urbanised than LDCs (44.6%) • Both will become more urbanised by 2050 • By 2050 LDCs will account for 82.5% of the world’s urban population, up from 73.0% in 2009, and 41.5% in 1950. Source: World Urbanisation Prospects 2009
Can the environment support an increase in global living standards with a growing population?
Population, development and the environment Since 1990: • Population has grown by a factor 1.4 (5.3 billion to 7.2) • Life expectancy has increased from 64.8 to 70.0 years • Number of people undernourished has declined from 1 billion (18.6%) to 868 million (12.5%) • Global forest cover has declined from 4.2-4.0 million hectares • Carbon emissions have increased from 21,523 to 32,578 million metric tonnes (factor 1.5) • Wild vertebrate species have fallen by more that one- third (31%) since the 1970s (GBO-3) • BUT
What do you think? Is population growth: • Good for the environment • Bad for the environment • Has no impact on the environment Is population growth: • The most important factor contributing to environmental degradation • One of a many factors contributing to environmental degradation • Not important at all
Dr. Paul R. Ehrlich The Doomsters… The idea that we can just keep growing forever on a finite planet is totally imbecilic…. Simon, a professor of junk mail marketing, and his kind, think technology will solve everything…. We can use up the Earth then we can just jump into spaceships and fly somewhere else…. Technology does nothing to solve problems of biodiversity or living space or arable cropland…. Fresh water and arable cropland are finite non-renewable resources…. We are already far beyond what we can support sustainably… We are a plague on the Earth. It’s coming home to roost over the next 50 years or so. It’s not just climate change; it’s sheer space, places to grow food for this enormous horde. Either we limit our population growth or the natural world will do it for us, and the natural world is doing it for us right now Sir David Attenborough
Malthus: The Principle of Population Thomas Malthus Essay on the Principle of Population as it affects the future improvement of society; with remarks on the speculations of Mr Godwin, M Condercet, and other writers (1798)
Humans are impelled to increase and if unchecked, the population will grow exponentially (2,4,8,16) • The resource base to support the population grows arithmetically (1,2,3,4) Exponential Growth In the natural order population growth will outstrip the food supply and the lack of food will ultimately put a stop to the increase of people
Malthusian Checks • Positive checks • Increase the death rate • hunger, disease, warfare • Preventative checks • Lower the birth rate • Control fertility through sexual restraint outside and within marriage (not contraceptives) • Ultimate consequence of population growth is poverty and misery
Easter Island • Once covered by palm forests but treeless at time of European arrival • Settled 500 BC - subsistence needs easily met - carving and moving statues • Forest reduction from 900 AD and palm forest gone by 1400. • Statues carved 1100 and 1500….transported using trees as rollers. • Loss of forest reduced water retention and led to soil erosion • Population declined from 10,000 in 1500 to 2,000 at time of European discovery in 1722. • Population growth degraded the environment to the point of collapse • Exacerbated by introduction of European disease, sheep and eucalypts [Brander and Taylor (1998) The Simple Economics of Easter Island. A Ricardo/Malthus Model of Renewable Resource Use. The American Economic Review, Vol . 88, No.1, pp. 119-138.]
The Boomsters Adding more people causes problems, but people are also the means to solve these problems. The main fuel to speed our progress is our stock of knowledge, and the brake is our lack of imagination. The ultimate resource is people – skilled, spirited, and hopeful people who will exert their wills and imaginations for their own benefit, and inevitably they will benefit not only themselves but the rest of us as well. The Ultimate Resource, 1981, 1996, Princeton UP Dr Julian Simon (1932-1998) Dr Bjorn Lomborg [Population] is not a great concern in most of the world right now... Yes, an extra person is an extra mouth to feed, but it's also two hands and a brain to work and to think, and it typically works out pretty even on those areas. Second ... we peaked in [terms of] percentage increase in the early 1960s; we peaked in absolute addition to the world in the early 1990s; and what we're seeing now in most developed-world [countries] is actually a decline in populations The SkepticalEnvironmentalist, 2001, Cambridge UP
Ester Boserup(1910-1999) • The Conditions of Agricultural Growth: The Economics of Agrarian Change Under Population Pressure • Argued that population growth is the major cause of agricultural change and that the principal mechanism of change is the intensification of land use through an increase in the frequency of cropping
Population growth is a stimulant... • Boserup (cont.) • Success of the Green Revolution in Asia was (in part) a function of the high population densities • Africa? • Julian Simon • The Ultimate Resource • Population growth is almost always beneficial for economic growth
Machakos, Kenya • Relatively dry and hilly area which experienced severe deforestation and soil erosion in the early colonial period from 1900 • By 1930 concerned to be an environmental disaster with an impoverished population of small farmers/pastoralists • Population increased from 240,000 (1930)to 1,393,000 (1989) (3% per annum) • Introduced controls on stocking rates , forest clearance, terracing and water management • Lead to intensification of farming (shorter fallow, wider variety of crops) • Improvement in transport infrastructure and links to Nairobi • Migration of men – off-farm • Changing gender roles [Gould, W.T.S (2009) Population and development [electronic resource], New York : Routledge]
What do geographers think? • Population dynamics affect the environment through other variables such as culture, consumption levels, institutions, and technology • More to population dynamics than population size and growth e.g. composition, household demographics • Increasingly concerned with the impacts of the environment on populations!