1 / 35

NAIROBI HOUSEHOLD TRAVEL PATTERNS SURVEY, 2004

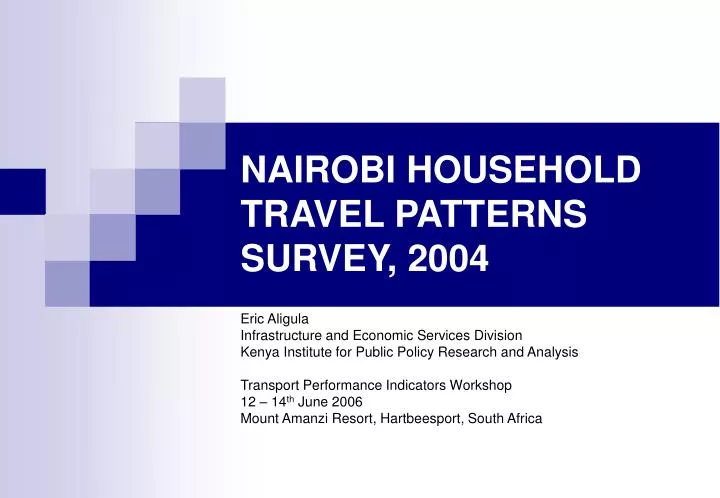
NAIROBI HOUSEHOLD TRAVEL PATTERNS SURVEY, 2004. Eric Aligula Infrastructure and Economic Services Division Kenya Institute for Public Policy Research and Analysis Transport Performance Indicators Workshop 12 – 14 th June 2006 Mount Amanzi Resort, Hartbeesport, South Africa.

kail
Download Presentation

NAIROBI HOUSEHOLD TRAVEL PATTERNS SURVEY, 2004

An Image/Link below is provided (as is) to download presentation Download Policy: Content on the Website is provided to you AS IS for your information and personal use and may not be sold / licensed / shared on other websites without getting consent from its author. Content is provided to you AS IS for your information and personal use only. Download presentation by click this link. While downloading, if for some reason you are not able to download a presentation, the publisher may have deleted the file from their server. During download, if you can't get a presentation, the file might be deleted by the publisher.

E N D

Presentation Transcript


  1. NAIROBI HOUSEHOLD TRAVEL PATTERNS SURVEY, 2004 Eric Aligula Infrastructure and Economic Services Division Kenya Institute for Public Policy Research and Analysis Transport Performance Indicators Workshop 12 – 14th June 2006 Mount Amanzi Resort, Hartbeesport, South Africa

  2. Background Information

  3. NAIROBI’S EXPANSION SINCE 1900

  4. Nairobi (pre-Independence Location)

  5. Population Dynamics of Case Study Area

  6. Location of Case Study Area(including Traffic Zones)

  7. TRAFFIC CENSUS CORDON POINTS

  8. Selected Findings Nairobi Travel Patterns Survey

  9. Household Expenditures on Transport

  10. Household Expenditures on Transport

  11. Household Expenditures on Transport

  12. MODAL SPLIT

  13. MODAL SPLIT BY GENDER

  14. DAILY TRIP GENERATION Estimated Total Number of Daily Trips (including public transport accessibility trips) 11,039,352

  15. TRIP GENERATION BY TRAFFIC ZONES

  16. TRIP GENERATION BY TRAFFIC ZONES

  17. TRIP GENERATION BY TRAFFIC ZONES

  18. ORIGIN-DESTINATION PATTERNS

  19. CORRIDOR UTILISATION

  20. VEHICLE OWNERSHIP PATTERNS

  21. MODE SELECTION CRITERIA BY GENDER

  22. RANKING OF MODE SELECTION CRITERIA BY GENDER

  23. HOUSEHOLD PREFERENCE OF TRANSPORT MODES 8 Most Preferred 0 Least Preferred

  24. VEHICLE OPERATING CREW RESULTS

  25. VEHICLE OPERATING CREW RESULTS

  26. VEHICLE OPERATING CREW RESULTS

  27. URBAN TRANSPORT SYSTEM PERFORMANCECasualty Index

  28. URBAN TRANSPORT SYSTEM PERFORMANCECasualty Index

  29. URBAN TRANSPORT SYSTEM PERFORMANCEPer Capita Fuel Utilization (Kshs per Passenger)

  30. URBAN TRANSPORT SYSTEM PERFORMANCECost of Poor Intersection Performance

  31. Measures to Make Transport Affordable

  32. Measures to Make Transport Affordable

More Related