Download
1 / 48
490 likes | 809 Views
theory and practice of Data Visualization. Media-X Stanford University. Visual Analysis Software. Visualization Reference Model. Data. Visual Form. Task. Raw Data. Data Tables. Visual Structures. Views . Data Transformations. Visual Encodings. View Transformations.

E N D
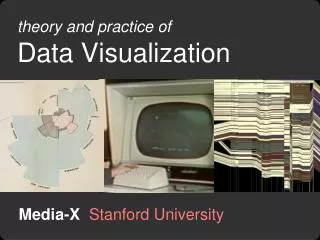
theory and practice ofData Visualization Media-X Stanford University
Visualization Reference Model Data Visual Form Task Raw Data Data Tables Visual Structures Views Data Transformations Visual Encodings View Transformations
NameVoyager http://www.babynamewizard.com/voyager
TimeSearcher [Hochheiser & Shneiderman 02] Based on Wattenberg’s [2001] idea for sketch-based queries of time-series data.
Interaction Techniques Dynamic Queries Filter a visualization through direct, reversable actions that avoid complex syntax.
how long in majors select high salaries avg career HRs vs avg career hits (batting ability) avg assists vs avg putouts (fielding ability) distribution of positions played Baseball Statistics [from Wills 95]
Interaction Techniques Dynamic Queries Filter a visualization through direct, reversable actions that avoid complex syntax. Brushing and Linking Highlight relationships between related items across multiple visualization views.
GGobi: Projections of nD data http://www.ggobi.org/
Dimensionality Reduction Dimensionality Reduction (Sometimes Considered Harmful)
The Multidimensional Detective The Dataset: • Production data for 473 batches of a VLSI chip • 16 process parameters: X1: The yield: % of produced chips that are useful X2: The quality of the produced chips (speed) X3 … X12: 10 types of defects (zero defects shown at top) X13 … X16: 4 physical parameters The Objective: Raise the yield (X1) and maintain high quality (X2) A. Inselberg, Multidimensional Detective, Proceedings of IEEE Symposium on Information Visualization (InfoVis '97), 1997
Inselberg’s Principles • Do not let the picture scare you • Understand your objectives • Use them to obtain visual cues • Carefully scrutinize the picture • Test your assumptions, especially the “I am really sure of’s” • You can’t be unlucky all the time!
Each line represents a tuple (e.g., VLSI batch) Filtered below for high values of X1 and X2
Look for batches with nearly zero defects (9/10) Most of these have low yields defects OK.
Notice that X6 behaves differently. Allow 2 defects, including X6 best batches
Parallel Coordinates Free implementation: Parvis by Ledermen • http://home.subnet.at/flo/mv/parvis/
Polaris Research at Stanford by Stolte, Tang, and Hanrahan.
Tableau Encodings Data Display Data Model
Tableau Demo The dataset: Federal Elections Commission Receipts Every Congressional Candidate from 1996 to 2002 4 Election Cycles 9216 Candidacies
Hypotheses? What might we learn from this data? • ??
Hypotheses? What might we learn from this data? Correlation between receipts and winners? Do receipts increase over time? Which states spend the most? Which party spends the most? Margin of victory vs. amount spent? Amount spent between competitors?
Polaris/Tableau Approach Insight: can simultaneously specify both database queries and visualization (c.f., Leland Wilkinson’s Grammar of Graphics) Choose data, then visualization, not vice versa Use smart defaults for visual encodings More recently: automate visualization design
Ordinal - Ordinal • Ordinal - Ordinal
All Marital Status 2000 Year 1990 1980 1970 60+ 40-59 Age 20-39 Sum along Marital Status 0-19 Single Married Divorced Widowed Sum along Age Marital Status All Ages All Years Sum along Year
All Marital Status 2000 Year 1990 Roll-Up 1980 1970 60+ Drill-Down 40-59 Age 20-39 Sum along Marital Status 0-19 Single Married Divorced Widowed Sum along Age Marital Status All Ages All Years Sum along Year
Visual Analysis Exercise Goal:Gain familiarity with one or more visual analysis toolsto explore data of interest. • Pick one or more data sets to investigate • Formulate initial questions or hypotheses • Select and use visual tools to explore data • Record findings and experiences, note how questions are refined or generated • Iterate!
Visual Analysis Exercise Choose one question of interest and prepare a final visualization to communicate your findings. After you have constructed the visualization, write a caption and short paragraph describing the visualization and what it reveals. Think of the figure, the caption and the text as material you might include in a research article.
Data Set Possibilities • Use your own data Any one interested in sharing?
Data Set Possibilities • Use your own data • Explore one of our sample data sets hci.stanford.edu/jheer/workshop/data Census database Crime statistics Election tallies and contributions
Data Set Possibilities • Use your own data • Explore one of our sample data sets • Download public data from the web
Trial Version of Tableau tableausoftware.com/visualization-workshop Tableau supports data in Excel spreadsheets, CSV files, or existing relational databases
Visualization Tools Many-Eyes http://many-eyes.com Verfiable http://verifiable.com GGobi http://ggobi.org Parvis http://home.subnet.at/flo/mv/parvis TimeSearcher http://www.cs.umd.edu/hcil/timesearcher Improvise http://www.cs.ou.edu/~weaver/improvise/ GGPlot2 (in R) http://had.co.nz/ggplot2/ and many others…
Tree / Network Tools GraphViz http://www.graphviz.org NodeXL http://www.codeplex.com/NodeXL GUESS http://graphexploration.cond.org/ Pajek http://pajek.imfm.si/doku.php TreeMap http://www.cs.umd.edu/hcil/treemap Workbench http://nwb.slis.indiana.edu/