Download
1 / 21
210 likes | 317 Views
Developing Web100 Based Network Configuration & Performance Measurement Tools. Web-100 Workshop Aug 1, 2002 by Rich Carlson Argonne National Laboratory. Motivation for work. Develop “single shot” diagnostic tool that doesn’t us historical data Measure performance to users desktop

E N D
Developing Web100 Based Network Configuration & Performance Measurement Tools Web-100 Workshop Aug 1, 2002 by Rich Carlson Argonne National Laboratory
Motivation for work • Develop “single shot” diagnostic tool that doesn’t us historical data • Measure performance to users desktop • Combine numerous Web100 variables to analyze connection • Develop network signatures for ‘typical’ network problems
ANL’s Web100 Based Approach • Single test to gather end-to-end data • Gather data from multiple variables • Compare measured performance to analytical values • Translate network values into plain text messages
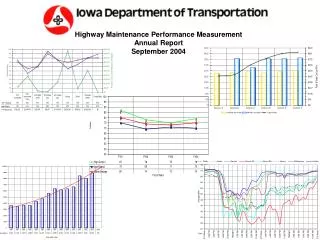
Different HW same Network port • 10 Mbps NIC • Jan 25 09:30:45 146.137.160.253 6826 6781 Kbs 5840 16382 B 0 20 ms 25 3 2 • 100 Mbps NIC • Jan 25 10:05:57 146.137.160.252 84557 86514 Kbs 5792 63712 B 0 10 ms 0 0 0
100 Mbps FD Ave Rtt %loss 5.41 0.00 1.38 0.78 6.16 0.00 14.82 0.00 10 Mbps 72.80 0.01 8.84 0.75 Speed 94.09 22.50 82.66 33.61 6.99 7.15 Sample results
100 Mbps FD Ave Rtt %loss loss/sec 5.41 0.00 0.03 1.38 0.78 15.11 6.16 0.00 0.03 14.82 0.00 0.10 10 Mbps 72.80 0.01 0.03 8.84 0.75 4.65 Speed 94.09 Good 22.50 Bad NIC 82.66 Bad reverse 33.61 Congestion 6.99 Good 7.15 Bad NIC Sample results
ANL developed tools • Web based tool • based on ORNL tool • modified analysis messages • Command line based tool • modified version of NLANR’s Iperf ver 1.2 • supports 2 new options • -e (-ee) print Web100 derived details • -R reverse direction of data flow • modified analysis messages
ANL developed tools • Geared toward campus area network • End-user based view of network • Provides some ‘hard evidence’ to users and network administrators to reduce finger pointing • Can be used to identify performance bottlenecks
Web Based Performance tool • Operates on Any client with a Java enabled Web browser • What it can do • Positively state if Sender, Receiver, or Network is operating properly • Provide accurate application tuning info • Suggest changes to improve performance
Web base Performance tool • What it can’t do • Tell you how a 3rd party is performing • Tell you where in the network the problem is • Tell you how other clients will perform
Network Signatures • Duplex Mismatch Detection • Connection is Congestion limited • CWNDtime > 30% • Have experienced packet loss • MaxSsthesh > 0 • Retransmitting packets • PktsRetrans/sec > 2 • Throughput is less than expected • estimate > 2
Network Signatures • Full/Half Duplex Detection • Connection is Receiver buffer limited • RWINtime > 95% • Connection transitions between Receiver limited and Sender limited • RwinTrans/sec > 30 • SendTrans/sec > 30
Current Deployment • 3 servers at ANL • Miranda Externally visible • Ophelia, Cordelia ANL Internal only • Servers support both Web based tool and Iperf based tool • Tools available via anonymous ftp from: achilles.ctd.anl.gov/pub/web100-tools
Future plans • Better estimate of path Bandwidth • receiver side packet pair arrivals • ACK packet timings • Explore receiver side statistics • Explore Gigabit Ethernet issues • Identify partners/collaborators
Caveats • Server needs time between tests (~90 sec) • Analysis messages need to be validated
Demo http://miranda.ctd.anl.gov:7123
Obtaining the test results • Runs 10 sec test from Client to Server • no diagnostic data collected • Runs 10 sec test from Server to Client • Web100 diagnostic data collected at end of test • Prints out summary status message • Link speed and duplex • Informational or Warning messages
Analyzing the test results • Statistics button • Send and Receive throughput achieved • Details for 5 configuration tests (link type, duplex mode, congestion, excessive errors, duplex mismatch condition) • Throughput limits section (%S-R-N limited, RTT, %loss, %out-of-order) • ‘Tweakable’ settings (TCP modifications to improve performance)
Analyzing the test results • More Details button • Individual TCP counters collected by Web100 • Conditional test parameters • Throughput analysis section including theoretical limits, bandwidth*delay products, loss rate, and buffer sizes
Analyzing the test results • Report Problem button • Invokes local email client <mailto:> • Automatically inserts collected data into body of email • Provides “comment” section for user feedback • Server logs all counter variables used for condition tests