Download
1 / 25
250 likes | 394 Views
Early Childhood Education The Research Evidence . Deborah Lowe Vandell December 11, 2003. The Challenge. Carnegie Report (1991) 35% of kindergarten children come to school “not ready to learn” Rimm-Kaufman (2003) Kindergarten teachers reports 15% have “serious problems”

E N D
Early Childhood Education The Research Evidence Deborah Lowe Vandell December 11, 2003
The Challenge • Carnegie Report (1991) • 35% of kindergarten children come to school “not ready to learn” • Rimm-Kaufman (2003) • Kindergarten teachers reports 15% have “serious problems” • 30% have “some problems” • 50% lack requisite pre-academic, cognitive, language, and social competencies
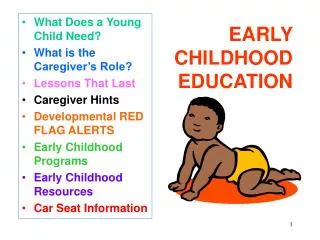
Components of School Readiness • Cognitive skills – memory, attention • Language skills – comprehension, expression • Pre-academic skills – letters, numbers • Social competence – work & play well with peers, work well with adults • Emotional well-being
Can Early Education Programs Help to Prepare Children to Succeed at School?
Substantial Numbers of Children are in Child Care and Early Education Programs • K class of 98-99 – 81% had child care experience (NCES – national survey) • 84% of the children of employed mothers and 43% of children of non-employed mothers are in child care and education • WI – 83% of children (ages 0-5 years) of employed mothers were in child care; 34% for 35 hrs or more; 26% for 15-34 hrs • WI – 25% programs; 46% relatives; 20% family day care; 5% in-home
Research Questions • What are the effects of high quality early education programs on cognitive and social development? • What are the effects of early child care of varying quality and types on child developmental outcomes?
Studying Effects of Early Education and Care on Child Developmental Outcomes • Experimental studies – random assignment; model programs • Quasi-experimental studies – treatment & comparison groups; large-scale publicly funded interventions • Correlational studies – naturally occurring variations
Evidence from Experimental Studies • Carolina Abecedarian Project • 57 treatment; 54 control children • 8 hrs/day, 5 days/wk, 50 wk/yr, 1st 5 yrs • Center-based, language focus, high-quality model program • Early intervention & school intervention
Abecedarian Findings • IQ: T>C at ages 8, 12 • Achievement tests: T > C at ages 8, 15, 21 • Special education: T<C at age 15 • Grade retention: T < C at age 15 • School drop out: T < C at age 21 • College attendance: T > C at age 21 • Average age 1st child born: T > C at age 21 • Cost-Benefit Analysis: $35,864 cost; $136,000 benefit to society
Perry Preschool Project • 58 treatment (T), 65 control (C) children • ½ day preschool on week days, plus a weekly 90-min. home visit • 8 months/yr for 2 years (entered age 3 or 4) • High quality program - Child:teacher ratio = 6:1; teachers with master’s degrees & early childhood training; early childhood curriculum
Perry Preschool Project Findings • IQ: T > C at ages 5, 7; T = C at ages 9, 14 • Achievement tests: T > C at ages 9, 14 • High school GPA: T > C • Arrests: T < C at age 27 • Employment: T > C at age 19; T = C at age 27 • Monthly earnings: T > C at age 27 • Public assistance: T < C at age 27 • Cost-benefit analysis: $12,000 costs; $108,000 benefit to society by reducing grade retention, special education placement, and increased high school graduation rates
Evidence from Quasi-Experimental Studies • Chicago Child-Parent Centers (large scale publicly funded) 989 treatment & 550 comparison students Title I early education program in 1985-86; emphasized skills in language & math through fairly structured activities Degreed teachers; high parent involvement
Chicago Child-Parent Center Findings • Reading achievement: T > C at ages 5, 8, & 14 • Math achievement: T > C at ages 5, 8, & 14 • Grade retention: T < C at age 15 • Proficiency skills tests: T > C at age 14/15 • Special education: T < C at age 18 • Delinquency & crime: T < C at age 17 • School dropout: T< C at age 20 • High school completion: T > C at age 20 • Cost-benefit analysis: $7000 costs, $48,000 benefit to society
Evidence from Correlational Studies: The NICHD Study of Early Child Care • Large sample (n = 1364) from 10 sites • Quality, amount, and type of child care measured from birth to kindergarten • Mothers and fathers observed and interviewed • Home observations • Cognitive, language, and social development assessed • Children studied from birth to age 12 years
Assessments of Child Care Quality • Observational Record of the Caregiving Environment (ORCE) – assesses children’s experiences with caregivers, peers, and materials • Early Childhood Environment Rating Scale (ECERS) – assesses the social, cognitive, and physical environment • Structural & caregiver characteristics
Higher child care quality predicted • Higher cognitive skills at 15, 24, 36, and 54 months and in first grade • Higher academic skills at 36 and 54 months • Higher language skills at 36 & 54 months • Higher social skills at 15, 24, and 36 months • Reduced behavior problems • Effects of child care quality were larger for children of low-income families.
Other Correlational Child Care Studies • National Academy of Science Committee (2003) • Cited 23 studies as finding relations between process quality and child outcomes • Cited 14 studies as finding relations between structural quality and child outcomes
What determines the cost of early education? • Design of the program – hours, services, quality • Who is eligible – targeted or universal • Take up rates • System costs – start-up and infrastructure
Estimated Costs-Per-Child for Quality Preschool • NIEER estimates an annual cost-per-child for an academic year program (180 days & 6 hr. day) at $8800. • Full time child care throughout the year adds 1370 hours at $8/hr, which yields would add $10,960 to the cost for full day year round preschool • Current participation rates for 4-yr-old – 1/3 half-day academic yr; 1/3 full-day academic year; 1/3 full-day year round.
Conclusions • Strong evidence from research that high quality early education and child care has positive effects on children’s cognitive, academic, and social outcomes and that poor quality care has negative effects. • Research and practice have identified the components of high quality early education programs and strategies to implement these components. • Now time for decisions about what early education policies to adopt