Download
1 / 65
660 likes | 786 Views
Twenty Years in the Making: A Focus on Process Industries Webinar: September 24, 2012. Supply Chain Index. Our Presenters Today. Lora Cecere Founder Supply Chain Insights. Abby Mayer Research Associate Supply Chain Insights. BRICKS. Book Publishes December 2012. Matter.

E N D
Twenty Years in the Making: A Focus on Process Industries Webinar: September 24, 2012 Supply Chain Index
Our Presenters Today Lora Cecere Founder Supply Chain Insights Abby Mayer Research Associate Supply Chain Insights
BRICKS Book Publishes December 2012 Matter The Role of Supply Chains in Building Market-Driven Differentiation LORA M. CECERE CHARLES W. CHASE JR.
Agenda • Background • What is Supply Chain Excellence? • A Look at Leaders • Wrap-up
Problems in Benchmarking • Self-reported data • Peer group relevance • Congruency: • Point in time • Similar data models • Holistic Views. Metric understanding
Average Days of Inventory by Year Source: Supply Chain Insights 2012
Average Days of Working Capital by Industry Source: Supply Chain Insights 2012
Agenda • Background • What is Supply Chain Excellence? • A Look at Leaders • Wrap-up
Supply Chain Management: Top 3 Elements of Pain for Respondent
Evolution of Supply Chain Process Excellence Align: Market Driven Resilient Efficient Cost Procure to pay/order to cash
Evolution of Supply Chain Process Excellence Align: Market Driven Adapt: Demand Driven Reliable Efficient Right Product Cost Right Place Procure to pay/order to cash Right Time Right Cost
Evolution of Supply Chain Process Excellence Align: Market Driven Adapt: Demand Driven Resilient Reliable Efficient Right Product Absorb Demand Volatility Cost Right Place Procure to pay/order to cash Right Time Absorb Supply Volatility Right Cost
Evolution of Supply Chain Process Excellence Align: Market Driven Adapt: Demand Driven Resilient Reliable Efficient Right Product Absorb Demand Volatility Sense Demand and Supply Cost Right Place Procure to pay/order to cash Right Time Absorb Supply Volatility Shape Demand and Supply based on Market Right Cost
Evolution of Supply Chain Process Excellence Align: Market Driven Building Horizontal Process Connectors Continuous Testing Learning Improving In Market Orchestrate Demand and Supply Adapt: Demand Driven Resilient Reliable Efficient Right Product Absorb Demand Volatility Sense Demand and Supply Cost Right Place Procure to pay/order to cash Right Time Absorb Supply Volatility Shape Demand and Supply based on Market Right Cost
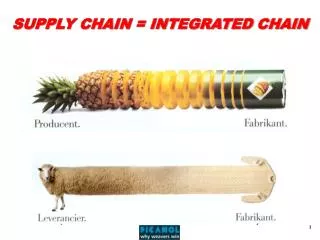
What is a Supply Chain? A Supply Chain is a Complex System with Complex Processes with Increasing Complexity
What is Best in Class? • Performance better than peer group • Year-over-year improvements • Consistency in results • Leadership in managing trade-offs and expanding the limits of the Effective Frontier
Agenda • Background • What is Supply Chain Excellence? • A Look at Leaders • Wrap-up
Cash-to-Cash Cycle vs. Gross Margin (2000-2011) SUMMARY SLIDE
Inventory Turns vs. Revenue per Employee (2002-2011) SUMMARY SLIDE
Audience Poll Who is the supply chain leader? • Colgate • Kimberly Clark • Kraft Foods • Procter & Gamble • Unilever • Cannot tell. No leader.
Cash-to-Cash Cycle vs. Gross Margin (2000-2011) SUMMARY SLIDE
Inventory Turns vs. Revenue per Employee (2002-2011) SUMMARY SLIDE
Audience Poll Who is the supply chain leader? • BASF • E I Du Pont • Dow Chemical • Cannot tell. No leader.