Download
1 / 19
190 likes | 321 Views
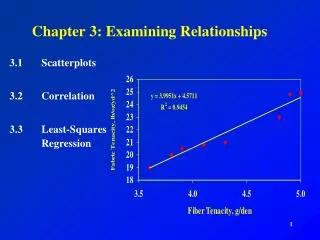
Examining Relationships. Section 3.2 Correlation. Recall from yesterday…. A scatterplot displays form, direction, and strength of the relationship between two quantitative variables. Strength.

E N D
Examining Relationships Section 3.2 Correlation
Recall from yesterday… • A scatterplot displays form, direction, and strength of the relationship between two quantitative variables.
Strength • Since we can’t always tell how “strong” or “weak” a relationship is by looking at a scatterplot, we can use a numerical measure... Correlation
Correlation • Measures the direction and strength of the linear relationship between two quantitative variables. • Usually written as r.
Correlation • For variables xand y for n individuals, the correlation r between x and y is xiand yi represent one individual. and represent the average of x and y. sxand sy represent the standard deviation for each variable.
Correlation • The formula for r begins by standardizing the observations
Creating Correlation in the Calculator • Insert list of numbers into L1 and L2 P. 142
Creating Correlation in the Calculator • 2nd Quit • Press STAT , choose CALC, then 2:2-VarStats.
Creating Correlation in the Calculator • Next, we’ll define L3. List 3 will represent: • In the home screen, press ( (L1- )/Sx) ( (L2 - )/Sy) L3 L1 Either 2nd 1 OR 2nd STAT 1 L2 Either 2nd 2 OR 2nd STAT 2 , , Sx, and Sy can be found under VARS 5 STO>
Creating Correlation in the Calculator Look under lists. There are now numbers under List 3
Creating Correlation in the Calculator To complete, enter the following command: (1/(n – 1))*sum(L3) n is under VARS 5 sum( is under 2nd STAT MATH
Easier Way… • ONLY WORKS WITH LINEAR RELATIONSHIPS! Press STAT CALC 4:LinReg(ax+b) ENTER If r does not show up: 2nd Catalog D Scroll down to DiagnosticOn. Push ENTER twice. Try the above commands again.
What we need to know to interpret correlation • Makes no distinction between exp. & resp. variables. • Requires both variables to be quantitative. • Changing units does not change r because it does not have units. It is just a number. • Positive r indicates a positive association, negative r indicates a negative association
What we need to know to interpret correlation • r will always be between -1 and 1. Values near 0 indicate a weak linear relationship. The closer to either -1 or 1, the stronger. • Measures strength of only a linear relationship between two variables. (does not describe curved) • Not resistant. Strongly affected by a few outlying observations. Use with caution when outliers appear in the scatterplot.
Example 3.7 Page 145 • Competitive divers are scored on their form by a panel of judges who use a scale from 1 to 10. The subjective nature of the scoring often results in controversy. We have the scores awarded by two judges, Ivan and George, on a large number of dives. How well do they agree? We do some calculation and find that the correlation between their scores is r = 0.9. But the mean of Ivan’s scores is 3 points lower than George’s mean. These facts do not contradict each other. They are simply different kinds of information. The mean scores show that Ivan awards much lower scores than George. But because Ivan gives every dive a score about 3 points lower than George, the correlation remains high. Adding or subtracting the same number to all values of either x or y does not change the correlation. If Ivan and George both rate several divers, the contest is high fairly scored because Ivan and George agree on which dives are better than others. The high r shows their agreement.
Practice Problems • Exercises 3.25, 3.26