Download
1 / 44
440 likes | 595 Views
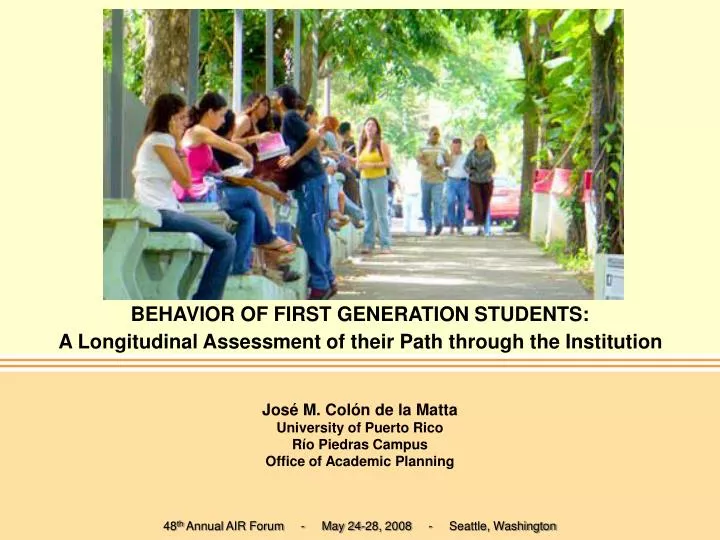
BEHAVIOR OF FIRST GENERATION STUDENTS: A Longitudinal Assessment of their Path through the Institution. José M. Colón de la Matta University of Puerto Rico Río Piedras Campus Office of Academic Planning . 48 th Annual AIR Forum - May 24-28, 2008 - Seattle, Washington .

E N D
BEHAVIOR OF FIRST GENERATION STUDENTS:A Longitudinal Assessment of their Path through the Institution José M. Colón de la Matta University of Puerto Rico Río Piedras Campus Office of Academic Planning 48th Annual AIR Forum - May 24-28, 2008 - Seattle, Washington
Purpose • Analyze the nature of the drop out/persistence behavior of the first-generation students and test variables that may represent factors that have impact on student’s persistence. • Investigate the time of departure of the first generation students in comparison with non-first generation.
Methodology This study is composed of two main parts, the second part is further subdivided in two stages. • First part - Estimation of the survival function • Second part - Logistic regression analysis • Stage 1 • Stage 2
Methodology of the first part • The proportion of students that stayed in the institution each semester (for a total of 12 semesters) was estimated by the Kaplan-Mier method (product limit estimation). • This method: • is very suitable to analyze survival-time data. • is very helpful for graphical representation of the survival function • allows for the comparison of Survival functions and test if there are significant differences.
Methodology of the first part • The interval time necessary to compute the survival function was defined as semester with values of up to 12, beginning at zero which represent the first semester and ending at the 12th semester or 6 years after the student enrolled in a degree seeking program. • Attrition behavior in this study is defined as:those students who left the institution at any time during the twelve semester period even though the student might have returned at any time during the period under analysis.
Methodology of the first part • The status is represented by a dichotomous variable: • 1 if the student attained the bachelor degree at any time during the 12 semester period and zero otherwise. • The time variable was defined as the sum of the semester periods that the students spent at the institution • From 1, the first semester, to 12, the 12th semester.
Methodology of the first part • The statistics for the equality testing of the survival functions were Log Rank, Breslow and Tarone-Ware. • Rejection of the Null Hypothesis is an indication that there are differences within groups, meaning that one of the groups has higher attrition rates than the other.
Methodology of the second part • Data was incorporated from three different sources: data from the general application form, first year students survey and second year students survey. • 32 items were selected and tested from the second year survey. This survey was designed to obtain information about the first year experience and student adaptation to the university life. Principal component analysis was performed to identify specific factors.
Methodology of the second part • Once the factors were identified, a multiple logistic regression model was developed to analyze the variables that explain the dichotomous outcome, the drop out/persistence behavior.
Data and Sample • This study used the 2000 first year cohort of a doctoral high research activity, highly selective and lower transfer in, urban public university. • For the first part of the study, the data of the 2,976 students cohort that enrolled at a degree seeking program on August 2000 was merged with the data from the first year survey file. • Records with missing essential information to conduct the analysis were excluded. For this research, 2,620 observations, which represent 88% of the population, were retained.
Data and Sample • For the second part of the research, the logistic regression analysis, the file containing the 2,620 observations was merged with the second year survey file. This exercise left 992 observations for the analysis.
Literature review • Data have been presented showing that retention rates are a function of the characteristics of students at the time of enrollment (Astin, 1997). • In the Tool Box Study, a total of 26 variables were introduced in a five stage logistic regression and 11 of these variables were found to be statistically significant. Academic resources and continuous enrollment in a postsecondary institution were the two most important variables and the ones that add more explanatory power to the model (Adelman, 1999).
Literature review • Among the numerous theories developed to explain the student’s path through college, the most comprehensive frameworks are Tinto’s Student Integration Model and Bean’s Student Attrition Model. • Bean declares that students have some kind of behavioral intentions to stay or leave. • The intentions are shaped by attitudes which in turn are affected or are a function of different components of the institutions, such as: quality, courses, and friends. • Bean recognized that other external factors or exogenous causes affect the student decision to stay or leave.
Literature review • Tinto’s Integration Model asserts that the congruency between students and institutions which help shaping commitments to educational goals influences the decision to stay or not to stay in the institution (Cabrera, Nora & Castañeda, 1993). • It is shown by various researches that higher education is affordable for most middle and upper income families and that many groups won’t be able to attend and finish their path through the institution within an acceptable time frame. For example, first generation students - those whose parents never attended college.
Literature review • It is been found that the risk of attrition of first generation students is 71% higher as compared with those students with college educated parents (Ishitani, 2003).
Literature review • A report published by the National Center of Education Statistics (NCES) in 2001, concluded that although enrolling in a postsecondary institution and reaching a degree depends on many factors, it is less likely for those whose parents have no education beyond high school. • The same study highlights the fact that those high school graduates whose parents did not go to college had lower educational expectations, were less prepared academically, and received little support from their family in planning and preparing for college, than those whose parents attended college (NCES, 2001-126).
Literature review • A study published in 2003, in an attempt to estimate the impact of being a first generation student on various cognitive and non-cognitive outcomes,found that first generation students lagged behind different factors of the college experience as compared to those students whose parents were both college graduates. “These included: full time enrollment; time devoted to study; course work in the sciences, mathematics and humanities; and work responsibilities” (Pascarella, Terenzini, Wolniak & Pierson, 2003).
Literature review • A study published by NCES in 2005 concluded that first generation students completed less credits, took fewer academic courses, earned lower grades, needed more remedial assistance, and were more likely to withdraw from or repeat courses when compared with those students whose parents attended college. • The consequences of these differences are that the chances of attaining a bachelor degree were lower for first generation students (NCES, 2005).
Literature review • In a more recent study that examined the educational aspirations and educational attainment of first generation college students, it was found that eight years after high school, 62.1% of the first generation students had not attained their original educational aspirations. • The authors suggest that first generation students arrive/enter college without a clear notion of the demands and expectations of higher education (McCarron & Inkelas, 2006). • Presumably this may be due to various factors related to persistence which include lack of institutional support and the lack of congruency between the student and the new environment.
Data analysis • The first part of this study consisted of the estimation of the Survival functions by the Kaplan-Meir methods. • The graphical representation of the functions are shown in Figures 1, 2 and 3.
Data analysis • The graph shows that the time of departure differed among the groups. • The hypothesis that the Survival functions were the same for both groups was rejected (p < 0.001), confirming that first generation students had higher attrition rate than those which had at least one parent with a college education.
Data analysis • Survival functions also confirm that the first generation students have higher attrition rate than those whose both parents have a college education.
Data analysis • The function closer to the first generation line pertains to the group in which only the mother have college education. • The hypothesis of equal Survival function was rejected (p < .10). • In the case of Only father with college education, the gap is wider when compared with Only mother with college education. • The function was found to be significant (p < .05 Breslow and Tarone–Ware tests and p < .10 Log Rank test).
Table 2. Survival Functions for the Observation Period (12 semesters)
Data analysis The survival rates of first generation students on average is: • 15% less than the students in which both parents have college education • approximately 12% less than the group with at least one parent with college education • 10.2% less than the group in which only the father had college education • approximately 5% less than those students whose only the mother have college education.
Data analysis • The second part of this study is an analysis of different variables that represent factors that have impact on student’s drop out/persistence. • This part consists of two stages: • First, the dimensionality of the factors of the 32 survey items were tested through the principal component analysis. • Second, regression coefficients of the logistic models were estimated.
Data analysis • The degree of correlation between the items was found to be significant (< .01 Bartlett’s Test of Sphericity). • Kaiser-Meyer-Olkin measure of sampling adequacy was 0.9, indicative that the factorial analysis was appropriate. • Factors with eigenvalues greater than one were kept. Factors loading below 0.5 were discarded and internal consistency of each factor was examined using Cronbach’s Coefficient Alpha.
Data analysis • Seven factors were identified. • The factors explained between 22.9% and 58.2% of the variance. • Institutional climate • Friendship support/Peer group interaction • Effectiveness of support services (Encouragement and support from faculty/staff) • Supportive and encouraging academic environment • Social adjustment • Goal commitment and attachment to the institution • Informal interaction with faculty
Data analysis • The independent variables of the model identify or replicate variables used to test persistence theories, such as Tinto’s Student Integration Model. • In this study, the variables explored were pre-college academic variables, individual attributes, educational goals and expectations, family background and socioeconomic status. • The seven components identified through the factor analysis were included in the logistic model.
Data analysis • Results of the best fitting models are presented in tables 4 and 5. • Variables found not-significant, the odds ratios under the column Exp (B) were excluded. • For variables with negative coefficients and significant, the inverse odds ratio was computed and added to the tables. This step was undertaken to ease the interpretation of the logistic regression (DesJardin, 2001)
Table 4. Drop out behavior (whole cohort) Dependent variable drop out =1; stay = 0
Table 5. Drop out behavior (First-generation students) Dependent variable drop out =1; stay = 0
Data analysis • First-generation students, as compared with the students whose at least one parent has college education were 1.45 times more likely to dropout in their second year. • Other categorical variables found significant in explaining attrition were the two pre college academic background variables: general admission index and type of high school.
Data analysis • Family income was significant during the second and fifth year. • The model was also checked for interaction and a significant interaction between gender and parent education during the second and fourth year was found. • First generation men have 3 times higher risk than females to drop out of the university.
Data analysis • In the case of the seven constructs defined before, which are continuous variables, the odds ratio represent a change in probability of the dependent variable as result of change of the independent variables. • In the second year, two of the seven constructs were found significant. • Both coefficients are negative. • Students who felt that the institution’s lack of a supportive academic environment are in more risk of departure. • The other significant construct is goal commitment which indicates that those that do not have well-defined goals in terms of the degree they aspire and their commitment to the institution, have higher risk of departure.
Data analysis • Results of the three regressions pertaining to the first generation group: • The general admission index and family income was significant for the fourth year. • In the first generation group gender was significant in all of the three years analyzed. • During the second year males have twice the risk of attrition when compared to females and during the fourth the risk increases more than six times.
Data analysis • Results of the three regressions pertaining to the first-generation group (continuous variables) • Four of the constructs were significant in explaining attrition during the second year: • Friendship support/Peer group interaction (-) • Effectiveness of supportive services (-) • Supportive and encouraging academic environment (-) • Well defined academic goals (-) • All constructs have a negative coefficient indicative that those first generation students that did not strongly agree with the constructs items were in more risk of attrition than those that strongly agreed. • Institutional climate was significant for the fourth year.
Data analysis • For the sixth year, five constructs were found significant: • Institutional climate (+) • Friendship support/peer group interaction (+) • Effectiveness of support services (+) • Social adjustment (-) • Informal interaction with faculty (+) • However, the coefficient of four of them are positive meaning that the higher they agree with the item the higher the attrition risk.
Concluding remarks • The first part of this study shows that first-generation students were in more risk of attrition than those students whose parents have a college education. • Attrition depends on other variables such as, pre-college academic background, individual attributes, educational goals and expectations, and family background as well as other institution-related factors • The results indicate that those first-generation students who did no strongly agree with the items included in the institutional related factors are in more risk of departure during their second year.