Download
1 / 1
10 likes | 115 Views
Investigating Polaron Generation in Organic Solar Cells Using Photoinduced Absorption Spectroscopy. Wei Peng Goh 1 , Zi En Ooi 1 , Evan L. Williams 1 , Joel K.W. Yang 1 , Wee Shing Koh 2 , Subodh Mhaisalkar 3. 1 Institute of Materials Research & Engineering, 3 Research Link, Singapore 117602

E N D
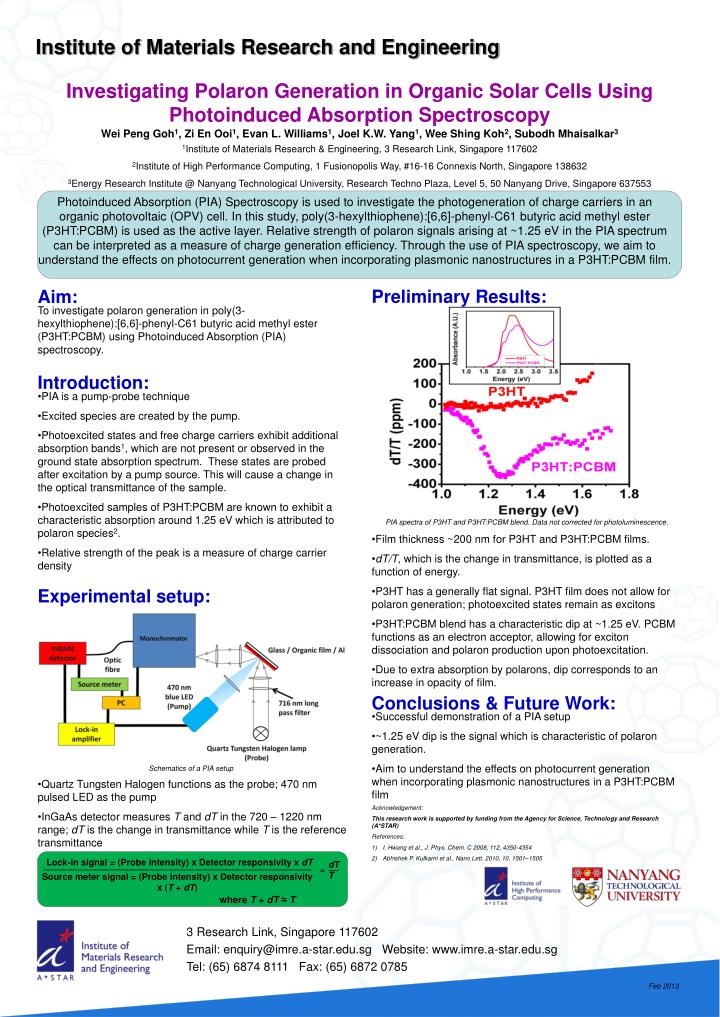
Investigating Polaron Generation in Organic Solar Cells Using Photoinduced Absorption Spectroscopy Wei Peng Goh1, Zi En Ooi1, Evan L. Williams1, Joel K.W. Yang1, Wee Shing Koh2, Subodh Mhaisalkar3 1Institute of Materials Research & Engineering, 3 Research Link, Singapore 117602 2Institute of High Performance Computing, 1 Fusionopolis Way, #16-16 Connexis North, Singapore 138632 3Energy Research Institute @ Nanyang Technological University, Research Techno Plaza, Level 5, 50 Nanyang Drive, Singapore 637553 Photoinduced Absorption (PIA) Spectroscopy is used to investigate the photogeneration of charge carriers in an organic photovoltaic (OPV) cell. In this study, poly(3-hexylthiophene):[6,6]-phenyl-C61 butyric acid methyl ester (P3HT:PCBM) is used as the active layer. Relative strength of polaron signals arising at ~1.25 eV in the PIA spectrum can be interpreted as a measure of charge generation efficiency. Through the use of PIA spectroscopy, we aim to understand the effects on photocurrent generation when incorporating plasmonic nanostructures in a P3HT:PCBM film. Preliminary Results: Aim: To investigate polaron generation in poly(3-hexylthiophene):[6,6]-phenyl-C61 butyric acid methyl ester (P3HT:PCBM) using Photoinduced Absorption (PIA) spectroscopy. Introduction: • PIA is a pump-probe technique • Excited species are created by the pump. • Photoexcited states and free charge carriers exhibit additional absorption bands1, which are not present or observed in the ground state absorption spectrum. These states are probed after excitation by a pump source. This will cause a change in the optical transmittance of the sample. • Photoexcited samples of P3HT:PCBM are known to exhibit a characteristic absorption around 1.25 eV which is attributed to polaron species2. • Relative strength of the peak is a measure of charge carrier density PIA spectra of P3HT and P3HT:PCBM blend. Data not corrected for photoluminescence. • Film thickness ~200 nm for P3HT and P3HT:PCBM films. • dT/T, which is the change in transmittance, is plotted as a function of energy. • P3HT has a generally flat signal. P3HT film does not allow for polaron generation; photoexcited states remain as excitons • P3HT:PCBM blend has a characteristic dip at ~1.25 eV. PCBM functions as an electron acceptor, allowing for exciton dissociation and polaron production upon photoexcitation. • Due to extra absorption by polarons, dip corresponds to an increase in opacity of film. Experimental setup: Conclusions & Future Work: • Successful demonstration of a PIA setup • ~1.25 eV dip is the signal which is characteristic of polaron generation. • Aim to understand the effects on photocurrent generation when incorporating plasmonic nanostructures in a P3HT:PCBM film Schematics of a PIA setup • Quartz Tungsten Halogen functions as the probe; 470 nm pulsed LED as the pump • InGaAs detector measures T and dT in the 720 – 1220 nm range; dT is the change in transmittance while T is the reference transmittance • Acknowledgement: • This research work is supported by funding from the Agency for Science, Technology and Research (A*STAR) • References: • I. Hwang et al., J. Phys. Chem. C 2008, 112, 4350-4354 • Abhishek P. Kulkarni et al., NanoLett. 2010, 10, 1501–1505 Lock-in signal = (Probe intensity) x Detector responsivity x dT dTT = Source meter signal = (Probe intensity) x Detector responsivity x (T + dT) where T + dT ≈ T Feb 2013