Download
1 / 1
10 likes | 144 Views
CSE3 Fall 2012. Computational Thinking By Stephanie Gear. Presentation of Information with Microsoft PowerPoint. Overview.

E N D
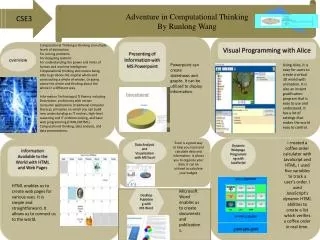
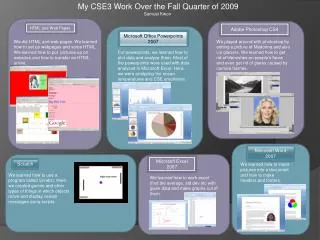
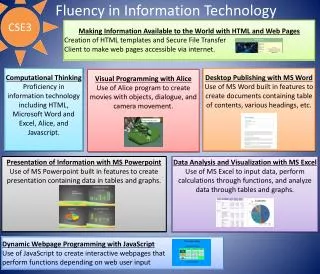
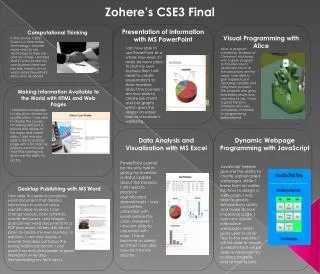
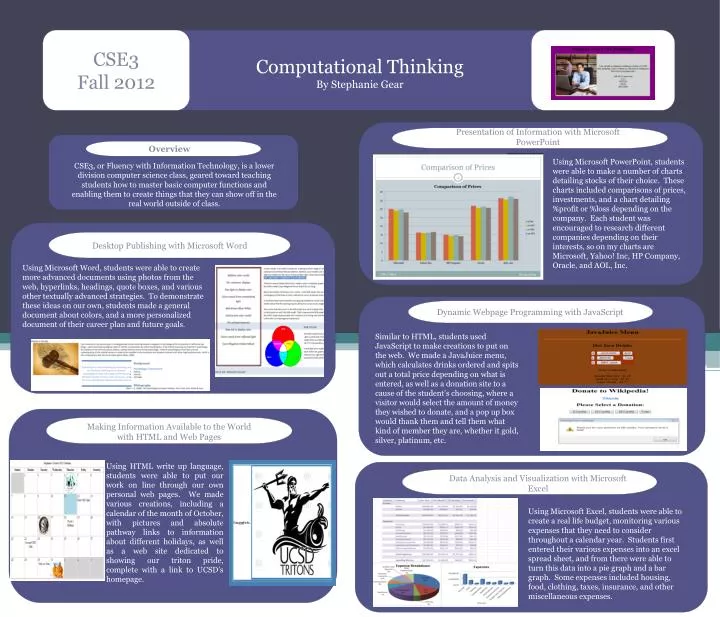
CSE3 Fall 2012 Computational Thinking By Stephanie Gear Presentation of Information with Microsoft PowerPoint Overview Using Microsoft PowerPoint, students were able to make a number of charts detailing stocks of their choice. These charts included comparisons of prices, investments, and a chart detailing %profit or %loss depending on the company. Each student was encouraged to research different companies depending on their interests, so on my charts are Microsoft, Yahoo! Inc, HP Company, Oracle, and AOL, Inc. CSE3, or Fluency with Information Technology, is a lower division computer science class, geared toward teaching students how to master basic computer functions and enabling them to create things that they can show off in the real world outside of class. Desktop Publishing with Microsoft Word Using Microsoft Word, students were able to create more advanced documents using photos from the web, hyperlinks, headings, quote boxes, and various other textually advanced strategies. To demonstrate these ideas on our own, students made a general document about colors, and a more personalized document of their career plan and future goals. Dynamic Webpage Programming with JavaScript Similar to HTML, students used JavaScript to make creations to put on the web. We made a JavaJuice menu, which calculates drinks ordered and spits out a total price depending on what is entered, as well as a donation site to a cause of the student’s choosing, where a visitor would select the amount of money they wished to donate, and a pop up box would thank them and tell them what kind of member they are, whether it gold, silver, platinum, etc. Making Information Available to the World with HTML and Web Pages Using HTML write up language, students were able to put our work on line through our own personal web pages. We made various creations, including a calendar of the month of October, with pictures and absolute pathway links to information about different holidays, as well as a web site dedicated to showing our triton pride, complete with a link to UCSD’s homepage. Data Analysis and Visualization with Microsoft Excel Using Microsoft Excel, students were able to create a real life budget, monitoring various expenses that they need to consider throughout a calendar year. Students first entered their various expenses into an excel spread sheet, and from there were able to turn this data into a pie graph and a bar graph. Some expenses included housing, food, clothing, taxes, insurance, and other miscellaneous expenses.