Download
1 / 37
370 likes | 623 Views
Changes in NAO and ENSO 3.4 and Their Effects on U.S. Climate. by Elise Lancaster METEO 497A April 22, 2003. Outline. Introduction Methodology Results Other Research Possibilities Conclusion. Introduction “The Idea”. Find the largest 2-3 month differences in NAO and ENSO 3.4

E N D
Changes in NAO and ENSO 3.4 and Their Effects on U.S. Climate by Elise Lancaster METEO 497A April 22, 2003
Outline • Introduction • Methodology • Results • Other Research Possibilities • Conclusion
Introduction“The Idea” • Find the largest 2-3 month differences in NAO and ENSO 3.4 • Note temperature and precipitation patterns of the month after the change
Methodology • Analyze NAO and ENSO 3.4 monthly values • Time Period: Nov - Apr (1950-present) • Data • NAO ftp://ftpprd.ncep.noaa.gov/pub/cpc/wd52dg/data/indices/tele_index.nhhttp://www.cpc.ncep.noaa.gov/data/teledoc/nao.html • ENSO ftp://ftp.ncep.noaa.gov/pub/cpc/wd52dg/data/indices/sstoi.indiceshttp://www.cpc.ncep.noaa.gov/data/indices/index.html
Methodology • Calculate 2 and 3-month changes in values • Examples • 2-month: Dec – Nov, Apr – Mar • 3-month: Jan – Nov, Apr – Feb • Determine largest changes/differences – use the most common month
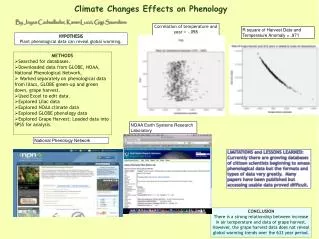
Methodology • Plot composites of the next month’s temperature and precipitation (http://www.cdc.noaa.gov/USclimate/USclimdivs.html)
Results • Graphs of values • Composite U.S. temperature and precipitation maps • Observations of the composites
NAO 2-month – ChangesTemperature • Warmer in eastern two-thirds of U.S. • Cooler in Northwest
NAO 2-month – ChangesPrecipitation • Dry in Southeast, lower Midwest, Rockies, and CA/OR • Wet in Great Lakes (especially MN/WI) and Ohio Valley
NAO 2-month + ChangesTemperature • Warmer over majority of U.S. • Warmest in western states • Cooler in Northeast and on Gulf of Mexico coast
NAO 2-month + ChangesPrecipitation • Dry in Northwest, CA, TX, OK, MO, AR, Great Lakes, Southeast, and Northeast • Wet in central Midwest, Southwest, and Ohio Valley
NAO 3-month – ChangesTemperature • Warmer in Northeast, Northwest, Great Lakes, and Rockies • Cooler in Midwest and Gulf of Mexico coast
NAO 3-month – ChangesPrecipitation • Dry in Northwest, Southeast, upper Midwest, and New England • Wet in Southwest, parts of Midwest, and PA region
NAO 3-month + Changes Temperature • Warmer on east coast and western U.S. • Cooler in Midwest
NAO 3-month + ChangesPrecipitation • Dry in Southwest and Northeast • Wet in Ohio River Valley and upper Midwest
ENSO 2-month – ChangesTemperature • Warmer in Northwest, upper/lower Midwest, CA coast, and southern FL • Cooler in Midatlantic, Ohio Valley, and Southeast
ENSO 2-month – ChangesPrecipitation • Dry in TX, FL, and upper Midwest • Wet in Northeast and Ohio River Valley
ENSO 2-month + ChangesTemperature • Warmer in Southeast, NM, OK, and northern TX • Cooler in Northwest, upper Midwest, ME
ENSO 2-month + ChangesPrecipitation • Dry in Southwest, Rockies, and FL • Wet in Great Lakes, Ohio River Valley, OR, WA, MS, and AL
ENSO 3-month – ChangesTemperature • Warmer in Northwest, Midwest, and Northeast • Cooler in Southeast, Midatlantic, and CA
ENSO 3-month – ChangesPrecipitation • Dry in TX and surroundings, upper Midwest, and FL • Wet in Ohio River Valley, Northeast, Great Lakes, and CA/OR
ENSO 3-month + ChangesTemperature • Warmer in Southwest and FL • Cooler in Northwest and upper Midwest
ENSO 3-month + ChangesPrecipitation • Dry in Southwest, Rockies, and FL • Wet in MN, Great Lakes, and Midatlantic
Other Research Possibilities • Same process, but by month • See monthly trends, not just most extreme trends • Note similar trends between NAO and ENSO
Conclusion • Trends are evident in NAO and ENSO monthly “jumps” • Trends can be used in long range forecasting