1 / 19

States & Capitals

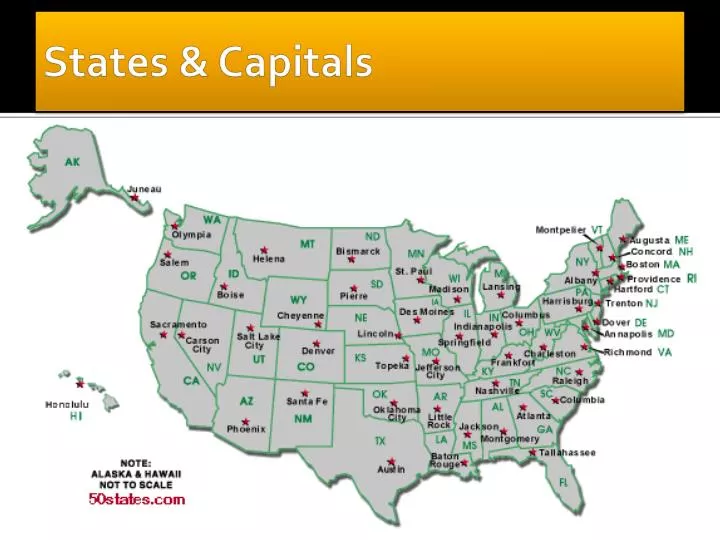
States & Capitals. Question to Consider: How might the demographics of a place impact political outcomes?. Demographic Maps of the United States. 2008 Election Results by State. 2008 popular vote by county. Cartogram of 2008 Election Results (scaled to states’ populations).

kaden
Download Presentation

States & Capitals

An Image/Link below is provided (as is) to download presentation Download Policy: Content on the Website is provided to you AS IS for your information and personal use and may not be sold / licensed / shared on other websites without getting consent from its author. Content is provided to you AS IS for your information and personal use only. Download presentation by click this link. While downloading, if for some reason you are not able to download a presentation, the publisher may have deleted the file from their server. During download, if you can't get a presentation, the file might be deleted by the publisher.

E N D

Presentation Transcript


  1. States & Capitals

  2. Question to Consider: How might the demographics of a place impact political outcomes? Demographic Maps of the United States

  3. 2008 Election Results by State

  4. 2008 popular vote by county

  5. Cartogram of 2008 Election Results (scaled to states’ populations)

  6. Cartogram of 2008 Election Results (scaled to states’ electoral votes)

  7. The following slides are based on the 2000 Census data

  8. Religion in America (based on a study from 2000)

  9. Sources • http://www-personal.umich.edu/~mejn/election/2008/ • http://www.censusscope.org/index.html • http://en.wikipedia.org/wiki/Religion_in_the_United_States • http://www.glenmary.org/grc/RCMS_2000/maps.htm

More Related