Download
1 / 15
150 likes | 275 Views
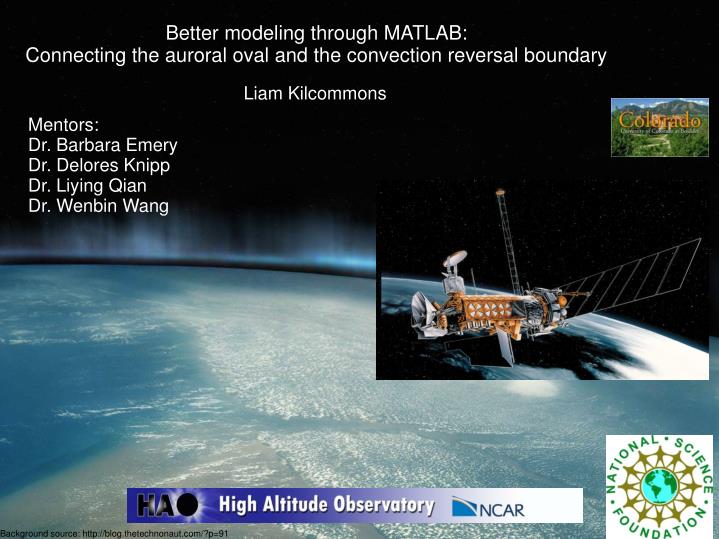
Better modeling through MATLAB: Connecting the auroral oval and the convection reversal boundary. Liam Kilcommons. Mentors: Dr. Barbara Emery Dr. Delores Knipp Dr. Liying Qian Dr. Wenbin Wang. Background source: http://blog.thetechnonaut.com/?p=91. Motive, Means, and Opportunity.

E N D
Better modeling through MATLAB: Connecting the auroral oval and the convection reversal boundary Liam Kilcommons Mentors: Dr. Barbara Emery Dr. Delores Knipp Dr. LiyingQian Dr. Wenbin Wang Background source: http://blog.thetechnonaut.com/?p=91
Motive, Means, and Opportunity Granted, the aurora is beautiful, but why bother studying it? The aurora is pretty well studied, what else is there to know? You can't really get to the aurora, so where do you get your data? Actually, it's pretty important: • Auroral particle precipitation associated with Joule heating, biggest energy input (besides solar radiation) into upper atmosphere • Ionospheric disturbances and accompanying electric and magnetic fields cause: • Power grid damage • GPS inaccuracy • Air travel re-route • Pigeon loss Lots! • Need better representation of atmosphere response to solar storms • Models' representation of aurora needs to be improved (2nd biggest energy input!) • In general: • ground based remote sensing • direct satellite measurements In this case: • Defense Meteorology Satellite Program satellites – aurora data • OMNI – satellite solar wind and ground based data from various sources
What's this Joule thing? Most familiar incarnation: Wires getting hotter due to current flow (a.k.aohmic heating) In upper atmosphere: Neutral atoms getting hotter due to collisions with energetic electrons and ions • Drives 'neutral winds' • Momentum transfer • Strong solar storms (lots of precipitation and fast ion convection) cause worldwide changes in neutral winds e ve ion vi Neutrals • Auroral precipitation: e- and p+ • Ion convection: ions of O, O2, N2etc vp p
Duskward, anti-sunward, and other mysterious directional adjectives Graphing as if one were looking down on the magnetic north pole Dawn 6 Noon N Pole (90º) 12 0/24 70º Midnight 80º Not to scale 18 Dusk Angular coordinate = magnetic local time (MLT) Radial coordinate = magnetic latitude (MLAT) http://www.atigun.com/photography/aurora-photographs/47-aurora-photographs
Ion Convection (or ion drift; the physics are the same) 6 View from the top N The Earth B 0/24 E 12 S Dawn-Dusk E-field! 18 Looks familiar... 6 6 DMSP Satellite in a dawn-dusk orbit 12 0/24 12 0/24 ExBgives direction ofvi vi Convection Reversal Boundary (CRB) 18 Vi? The Ion Drift Velocity 18
Our Data Sources: DMSP Satellites +X indicates Along-Track Direction Y indicates Cross-Track Direction -Z is Earthward Direction SSJ4 – Electron Flux IDM – Ion Drift Meter
The beginning of this presentation, finally 6 The (scientific) problem: • TIE-GCM needs to calculate Joule heating • Joule heating calculation requires relative locations (difference in radii) of CRB and auroral oval • Positions change constantly and drastically with changes in solar wind • TIE-GCM uses a constant (CRB 2 degrees duskward of auroral max flux) 0/24 12 N.P. 18 My goal: • Gather statistics on real life relative CRB and aurora positions • Revise a MATLAB data display program to display the CRB and aurora positions for a particular pass of a particular DMSP satellite on a particular day.
How I Spent My Summer Vacation The (Programming) Problem: • Need a flexible graphical display environment to visualize many kinds of data with different formats Why? • 'Big picture' view of sun interacting with high latitude upper atmosphere The Specifics: • Incorporate solar data, auroral flux, and ion drift velocities • Visualize many different variables, whatever user wants
No Need to Reinvent the Wheel, Just Figure Out How It Rolls The foundation for our visualization tool was Data_Plotter: • Matlab GUI ~ 6000 lines of code • Originally designed to study neutral density response for specific solar events
No Need to Reinvent the Wheel, Just Figure Out How It Rolls The foundation for our visualization tool was Data_Plotter: • Matlab GUI ~ 6000 lines of code • Originally designed to study neutral density response for specific solar events Biggest Challenge
CRB CRB Max Flux Max Flux
....and then, last night, around 11 pm there were: (Preliminary) Results! CRB Max Flux CRB Max Flux
Future Work • Perfect CRB and auroral maximum-flux-point finding algorithms • Gather statistics on position of aurora center and CRB center and their relative radii as a function of solar wind parameters • Compare results to modeled results • Use results to devise empirical model for estimating center position and radii of auroral oval with respect to CRB • Integrate model into TIEGCM for better Joule heating calculation THANK YOU! QUESTIONS?


![[f´‚nE˘RIks]](https://cdn0.slideserve.com/636013/f-ne-riks-dt.jpg)