Download
1 / 1
10 likes | 236 Views
GOES-R AWG Visibility Retrieval and Visibility-Fires Analysis over Western United States for 2007-2008. 328. Jason Brunner (UW-Madison/CIMSS), R. Bradley Pierce (NOAA/NESDIS/STAR), Allen Lenzen (UW-Madison/CIMSS), and James Szykman (NASA/EPA/LaRC).

E N D
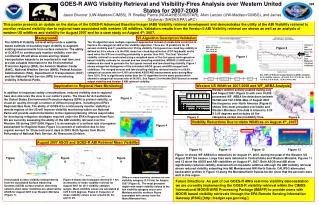
GOES-R AWG Visibility Retrieval and Visibility-Fires Analysis over Western United States for 2007-2008 328 Jason Brunner (UW-Madison/CIMSS), R. Bradley Pierce (NOAA/NESDIS/STAR), Allen Lenzen (UW-Madison/CIMSS), and James Szykman (NASA/EPA/LaRC) This poster presents an update on the status of the GOES-R Advanced Baseline Imager (ABI) Visibility retrieval development and demonstrates the utility of the ABI Visibility retrieval to monitor reduced visibility due to regional haze associated with western US wildfires. Validation results from the Version 5 ABI Visibility retrieval are shown as well as an analysis of western US wildfires and visibility for August 2007 and for a case study on August 4th, 2007. Background V5 Algorithm Description/Validation The GOES-R Visibility retrieval will provide a satellite-based estimate of boundary layer visibility to augment existing measurements from surface networks. The ability of GOES-R to continuously monitor visibility over the continental US will allow smoke and fog related transportation hazards to be monitored in real time, and provide valuable information to the Environmental Protection Agency (EPA), the Aviation Weather Center (AWC), National Weather Service (NWS), Federal Aviation Administration (FAA), Department of Transportation (DOT) and the National Park Service (NPS) for monitoring visibility in National Parks. The V5 algorithm uses multiple regression approaches instead of simple bias correction to improve the categorical skill of the visibility algorithm. There are 10 predictors for V5 aerosol visibility and 11 predictors for V5 fog visibility. First guess low cloud/fog visibility is defined as 3.0/s where s is the PBL mean low cloud/fog extinction (COT/fog depth) and is used when the IFR low cloud/fog probability is greater than 50%. The final “blended” visibility retrieval is constructed using a weighted mean of the first guess and regression-based visibility estimate for aerosol and low cloud/fog visibilities. MODIS L2 AOD and L1 radiances are used to generate the first guess aerosol and low-cloud/fog visibility. Figure 1 shows categorical histograms of the coincident ASOS (green) and ABI merged (red) visibilities. The merged aerosol and low-cloud/fog visibility retrieval results in a 66.6% categorical success rate for 4,165 coincident ASOS/ABI measurement pairs during May-June 2010. This is significantly better than the V3 algorithm for the same period which showed a categorical success rate of 59.26%. See Figure 2 for Heidke Skill Scores for model output visibility and Version 5 ABI retrieval visibility. Version 5 ABI Retrieval Score for Clear (>30km) and Moderate (10-30km) visibilities Clear: 16-23 dV Moderate: 23-34 dV Low: 34-50 dV Poor: 50-80 dV Figure 2 Figure 1 Eta, WRF, GFS Model Output Statistics (MOS) validation for 5 visibility classes: <0.5 (0.8), 0.5-1.0 (0.8-1.6), 1.0-3.0 (1.6-4.8), 3-5 (4.8-8.0), >5 (8.0) miles (km) Application to Regional Haze Monitoring Western US Wildfires 2007-2008 and WF_ABBA Analysis Western wildfire activity peaked during July and August 2007 (Figure 5)with over 10,000 processed WF_ABBA fire detections between 30-50N and 102-130W. Map of August 2007 fire frequency over North America (Figure 6) shows fires most prevalent over Idaho and Western Montana. Fire data is binned to 0.25 X 0.25 degrees and includes all fire categories except low possibility fires. In addition to important safety considerations, reduced visibility due to regional haze also obscures the view in our nation’s parks. The Clean Air Act authorizes the United States Environmental Protection Agency (EPA) to protect visibility, or visual air quality, through a number of different programs, including the EPA’s Regional Haze Rule. The ability of GOES-R to continuously monitor visibility in remote regions of the US will improve visibility monitoring within our National Parks and provide useful information to the regional planning offices responsible for developing mitigation strategies required under the EPA’s Regional Haze Rule. We are currently assessing the ability of the ABI visibility retrieval over the Western US during 2007-2008. Figure 3 is an example of a uniform rate of progress assessment for Regional Haze. Figure 4 is percent of extinction due to fine organic aerosol for 20 percent worst days in 2003. Both figures from Bruce Polkowsky of National Park Service, Air Resources Division. Figure 3 Figure 5 Figure 6 Visibility Reductions Due to Idaho Wildfires on August 4th, 2007 Figure 4 CALIPSO Track Region of ABI visibility reductions Clear Moderate Low Poor August 2007 ASOS and GOES-R ABI Retrieval Mean Visibility Figure 10 Figure 11 Figure 12 Figure 13 24 dV Figure 10 shows WF-ABBA fire detections for August 4th, 2007, during the peak of the Western US August 2007 fire season. Large fires were detected in Central Idaho and Western Montana. Figures 11 and 12 show the ASOS and ABI visibilities on August 4th, 2007. Both ASOS and ABI show significantly reduced visibility downwind from the Idaho wildfires although the ABI visibility retrieval shows reduced visibility extending into NE Montana and NW North Dakota. CALIPSO attenuated backscatter profiles in Figure 13 along the Montana/North Dakota border show that the aerosols were aloft in this region. Figure 7 Figure 8 Figure 9 21 dV 35 dV Poor Low Moderate Clear GOES-R mean visibility retrieval for low visibility category (2-10 km) for August 2007 (Figure 9). The most prevalent region with mean visibility values in the low visibility category occur over Montana and the northern Plains associated with smoke from the Idaho/Montana fires. Figure 8 shows line histogram (binned in 1 km increments) of mean visibility retrieval for August 2007 for all 4 visibility category ranges. Mean visibility values are calculated at 0.25 X 0.25 degrees. Peaks in frequency of mean visibility values occur around 35, 24, and 21 dV. Untruncated surface visibility measurements from the Automated Surface Observing Systems (ASOS) surface weather observing network show lower visibilities are observed by ASOS for August 2007 over Western Montana (Figure 7). Future Directions: As part of our GOES-R AWG real-time visibility demonstration we are currently implementing the GOES-R visibility retrieval within the CIMSS International MODIS/AIRS Processing Package (IMAPP) to provide users with MODIS based visibility retrievals through the EPA Remote Sensing Information Gateway (RSIG) [http://badger.epa.gov/rsig/]


