Download
1 / 14
140 likes | 262 Views
Supply Shifts Review. Assume that B is the initial curve. Equilibrium. Market Demand 200 Buyers. Market Supply 200 Sellers. 6 5 4 3 2 1 0. S. P. Q s. P. Q d. $5 4 3 2 1. 12,000 10,000 7,000 4,000 1,000. $5 4 3 2 1. 2,000 4,000 7,000 11,000

E N D
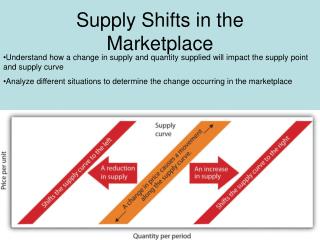
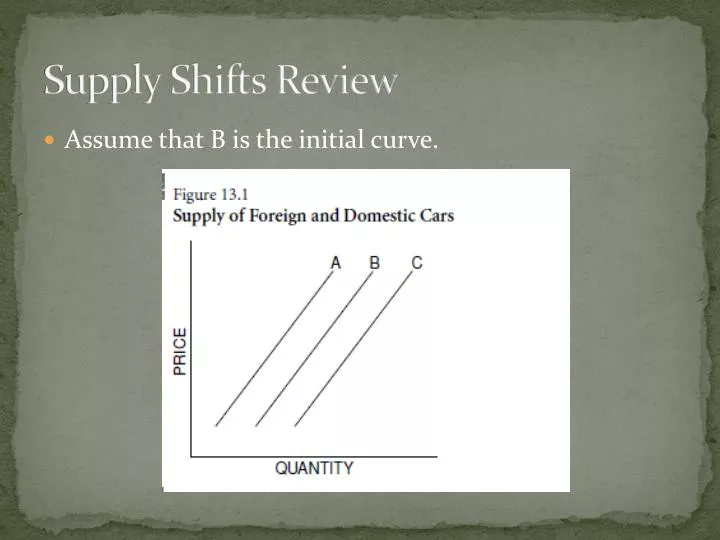
Supply Shifts Review • Assume that B is the initial curve.
Equilibrium Market Demand 200 Buyers Market Supply 200 Sellers 6 5 4 3 2 1 0 S P Qs P Qd $5 4 3 2 1 12,000 10,000 7,000 4,000 1,000 $5 4 3 2 1 2,000 4,000 7,000 11,000 16,000 Price (per bushel) 3 D 7 2 4 6 8 10 12 14 16 18 Bushels of Corn (thousands per week)
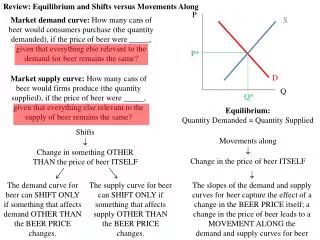
Increase in Demand • What happened to the equilibrium price? • Increased • What happened to the equilibrium quantity? • Increased
Decrease in Demand • What happened to the equilibrium price? • Decreased • What happened to the equilibrium quantity? • Decreased
Increase in Supply • What happened to the equilibrium price? • Decreased • What happened to the equilibrium quantity? • Increased
Decrease in Supply • What happened to the equilibrium price? • Increased • What happened to the equilibrium quantity? • Decreased
Increase in Both Supply and Demand • What happened to the equilibrium price? • Indeterminate • What happened to the equilibrium quantity? • Increased
Decrease in Both Supply and Demand • What happened to the equilibrium price? • Indeterminate • What happened to the equilibrium quantity? • Decreased
Increase in Demand, Decrease in Supply • What happened to the equilibrium price? • Increased • What happened to the equilibrium quantity? • Indeterminate
Decrease in Demand, Increase in Supply • What happened to the equilibrium price? • Decreased • What happened to the equilibrium quantity? • Indeterminate
Disequilibrium • Quantity supplied does NOT equal quantity demanded • Market will self correct to get back to equilibrium • Shortage—lower than market price, so QD greater than QS • Surplus—higher than market price, so QS greater than QD
Price Ceiling—gov. set maximum price, helps consumers Market Demand 200 Buyers Market Supply 200 Sellers 6 5 4 3 2 1 0 S P Qs P Qd $5 4 3 2 1 12,000 10,000 7,000 4,000 1,000 $5 4 3 2 1 2,000 4,000 7,000 11,000 16,000 Price (per bushel) 3 $2 Price Ceiling Shortage D 7 2 4 6 8 10 12 14 16 18 Bushels of Corn (thousands per week)
Price Floor—gov. set minimum price, helps producers Market Demand 200 Buyers Market Supply 200 Sellers 6 5 4 3 2 1 0 Surplus S P Qs P Qd $5 4 3 2 1 12,000 10,000 7,000 4,000 1,000 $5 4 3 2 1 2,000 4,000 7,000 11,000 16,000 $4 Price Floor Price (per bushel) 3 D 7 2 4 6 8 10 12 14 16 18 Bushels of Corn (thousands per week)
Card # 5 and #6 • Card #5—Double Shifts Draw a demand and supply graph for an example product Give two scenarios—one that will shift demand and one that will shift supply. Show the shifts on the card. Use a different color and label the new equilibrium E1 Tell me what happened to price and quantity One variable will be unknown—Don’t say “Stays the Same” • Card #6 Price Ceilings and Floors Draw a demand and supply graph for an example product—You need numbers the P and Q axes. Ask a question about a government set price and what will result from the set price (what happens to QD, QS, amount sold). You must use the words price ceiling or price floor. Answer your question.