Download
1 / 18
180 likes | 328 Views
NALMA Network. LNOM Analysis Cylinder (vertical extent is 0-21km) Mimics a CMAQ grid volume. Examine all flashes in cylinder for August 2006. Router. Initial Processing. McCaul VHF Source Clustering Algorithm Ingests LMA data

E N D
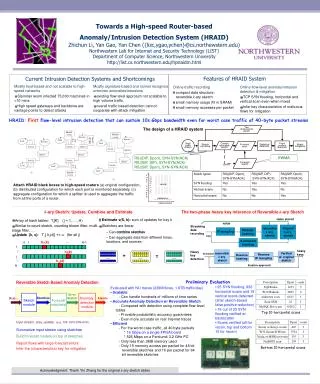
NALMA Network LNOM Analysis Cylinder (vertical extent is 0-21km) Mimics a CMAQ grid volume. Examine all flashes in cylinder for August 2006. Router
Initial Processing • McCaul VHF Source Clustering Algorithm • Ingests LMA data • Clusters (chi-square < 2) vhf sources into “Things” • “Things” are: Flashes, Small (Non-lightning) Discharges, Noise • LNOM “Thing” Filtration • Range Filter (remove “thing” if completely outside cylinder) • Number Filter (remove “thing” if <20 vhf sources… e.g., singletons) • What remains: legitimate flashes that are at least partially in cylinder • LNOM VHF Source Filtration • Power Filter (remove vhf source if power < 1 dbW) • Altitude Filter (remove vhf source if at sfc or >=20km) • LNOM Flash-Type Categorization • Deemed a CG if a NLDN CG detection is within (100 ms, 10km), and • lowest altitude vhf is below N-region height. • But, deemed ambiguous if peak current is between 10 - 20 kA. • LNOM Processing of VHF Sources in Legitimate Flashes • Coordinate Transformation • Spatial Averaging • Sorting
Channel Length Algorithm • Begin with n averaging points (n = 5 in example below) • 1st Iteration: • Start at the highest altitude point. Define it to be “on the • channel”, and all other points to be “free” (off channel). • Draw line from starting point to closest free point. This • is the first channel “section”. • Now there are 2 points on the channel, and n-2 free points Starting point
Channel Length Algorithm (cont.) • 2nd Iteration: • Find closest free point to 1st channel point • Find closest free point to 2nd channel point • Pick min of the mins (i.e., draw line from a free point to a • channel point that is the minimum distance). • Continue with more iterations until no more free points Starting point
Computing Segment Altitude Distribution Contributes to NOx in Cylinder • Chop up Channel into 10-m Segments • Tally segments in each 100 m layer • (only within cylinder)
Additional Current/Future Work • We have now completed all months in 2005, 2006, and 2007. Working on 2008, 2009, and 2010. • My work over the past several months has been to complete flash clustering analysis for 2005-2010. • Currently working on DCLMA analysis for 2007. • LNOM results being made available to multiple research partners: • NASA GSFC • UAH • Georgia Tech • Harvard • NASA GISS • LNOM results will be placed on Global Hydrology Resource Center (GHRC) website to better serve customers.