Download
1 / 29
290 likes | 293 Views
This article explores the average feed costs on dairy farms in Fond du Lac and other parts of Wisconsin. It provides sources for feed cost data, information on purchasing feed, and the impact of feed efficiency on milk production. The article also discusses benchmarking and future plans for a web-based tool to track and compare feed costs.

E N D
Feed Costs on Fond du Lac Farms(& Others) Paul Dyk December 11 2009 Dairy Forage Day
What does is cost to feed a cow? • Sources • Nutritionist • USDA • Averages • Base Diets • Good for Trends • Where am I at?
What is the average Feed Cost on WI Dairy Farm? • WI Center for Dairy Profitability • Purchased Feed Costs • What is purchased? • Protein & Minerals • Corn • Heifer Feed • Forages? • Combination of the above
Small Survey / Tool Development • Agents across the state • Development of Collection tool (online and spreadsheet) • Collection of data from across the state
Wisconsin Dairy Feed Evaluator • General, Production, and Income Information • Farm and reporter identification • Milk and components • Price received for milk 8 Victor E. Cabrera, Dairy Ration Economics, 4 December 2009
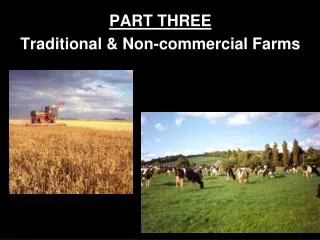
Farms included • 3 parts of the state (Fond du Lac, Jefferson, West Side of State) • Collect info on farm, assistance of nutritionists and producers • Purchased prices were current prices of feed (may include contracts)
What Prices to Use for Forages? • Producer Prices • Guesses at best • Not moisture adjusted • Not based on markets or actual costs • Standardize • All US Alfalfa Hay Price • Corn Price Received WI • Corn Silage (multiplied by 10)
Can we compare farms? • Issues with home grown feed • Issues with corn prices • Issues with quality of information
Standardized Forage Prices • All US Hay Price • Tracked and Published by USDA • September 2009, $110/ton
Standardized Corn Price • Corn Price Received WI • From USDA • October 2008, $4.00/bu (OK, $3.98) • $4/bu or $142.86/ton + $15 processing = $158/ton • Purchased corn price used where applicable • Corn Silage Price • $40/ton • Coming out of silo (includes harvesting, packing, fermentation)
Feed Efficiency • Dairy or feed efficiency reflects the level of fat-corrected milk yield produced per unit of dry matter consumed with an optimal range of 1.4 to 1.8 pounds of milk per pound of dry matter. • Days in milk, age, growth, changes in body condition score, body weight, forage quality, feed additives, and environmental factors will impact feed efficiency values. • One group all cows, 1.4 to 1.6 • (Hutjens, 2005)
Monensin Effects Table 4. Summary of effectiveness of monensin by level (nine studies). Level of monensin (g/ton) Control 11g/t 15g/t 22g/t Dry matter intake (lb/day) 43.9 43.4 42.8 42.3 Milk yield (lb/day) 65.0 66.7 66.8 67.5 Milk fat (%) 3.65 3.53 3.49 3.38 Milk protein (%) 3.15 3.13 3.13 3.10 Solids corrected milk (lb) 58.2 58.6 58.0 58.0 3.5% FC milk (lb) 66.1 66.8 66.7 66.0 Dairy eff (lb 3.5/lb DM) 1.50 1.54 1.56 1.56 Imp milk efficiency (%) control + 2.0 +2.5 +4.0
Future Plans • Web-Based Tool • Available to Public? • Why? • Track on farm trends • Compare clients from one nutritionist • Compare across nutritionists
Benchmark of Wisconsin IOFC • Farm #5: $3.13, 13.3% 92.3% 7.6% 27 Victor E. Cabrera, Dairy Ration Economics, 4 December 2009 7.6% 66.7%
Acknowledgements • Cabrera, Victor (UWEX) • Shaver, Randy (UWEX) • Bolton, Sterry, Milligan (UWEX)