Download
1 / 41
450 likes | 718 Views
Michael Jensen, MD Division of Endocrinology and Metabolism Department of Internal Medicine Mayo Clinic and Foundation, Rochester, MN, USA. Fatty Acid Metabolism in Humans. Overview. Adipose function in humans Free fatty acids (FFA) and health Regulation of FFA metabolism

E N D
Michael Jensen, MDDivision of Endocrinology and Metabolism Department of Internal Medicine Mayo Clinic and Foundation, Rochester, MN, USA Fatty Acid Metabolism in Humans
Overview • Adipose function in humans • Free fatty acids (FFA) and health • Regulation of FFA metabolism • FFA in different types of obesity
Fat and Lean Interactions Adipose tissue Lean Body Mass
Body Fat in Humans % body fat Lean men Lean women Obese men Obese women Adapted from Nielsen S et al. J Clin Invest 2004; 113: 1582-8
Regional Body Fat in Humans: Where Is It? SQ: subcutaneous % of fat in region Lean women Lean men Adapted from Nielsen S et al. J Clin Invest 2004; 113: 1582-8
Regional Body Fat in Humans: Where Is It? SQ: subcutaneous % of fat in region Obese men Upper body obese women Lower body obese women Adapted from Nielsen S et al. J Clin Invest 2004; 113: 1582-8
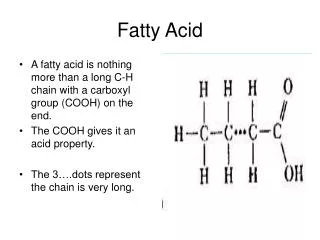
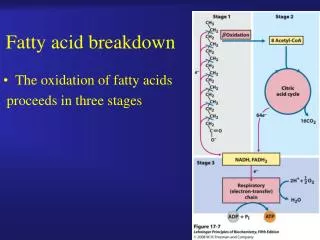
Fatty Acid Metabolism in Humans • Virtually all fatty acids originate from dietary triglyceride fatty acids. • Long-term storage site is adipose tissue. • Regulated release of fatty acids as free fatty acids provides the majority of lipid fuel for postabsorptive adults.
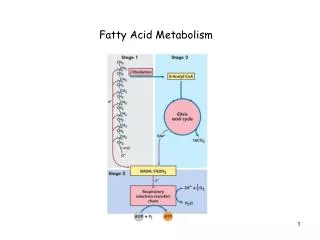
Fatty Acid Metabolism in Humans Direct Oxidation CO2 + H2O (20-70 gm) Adipose tissue (30-80 gm) TG fatty acids Oxidation100 gm Chylomicron TG100 gm FFA FFA: free fatty acids TG: triglycerides
Adipose Physiology Adipocyte FFA Glycerol Insulin Triglycerides FFA: free fatty acids
Adipose Physiology Adipocyte FFA Glycerol Insulin Triglycerides FFA: free fatty acids
Adipose Physiology Adipocyte FFA Glycerol Growth hormone catecholamines Triglycerides FFA: free fatty acids
Adipose Physiology Adipocyte FFA Glycerol Growth hormone catecholamines Triglycerides FFA: free fatty acids
Energy Expenditure, Sex, and Free Fatty Acids (FFA) • What drives the release of FFA in the postabsorptive state? • What is “normal” FFA release? • How does FFA release differ in men and women, lean and obese? • Does body fat distribution relate to basal lipolysis? • Do circulating hormone levels relate to basal lipolysis?
Energy Expenditure, Sex, and Free Fatty Acids (FFA) • 50 healthy research volunteers: • 50% women (all premenopausal) • 50% obese • Body composition: • DEXA (fat and fat-free mass) • CT abdomen for visceral and subcutaneous fat • Fat cell size (abdomen & gluteal) • Isoenergetic diet in GCRC x 2 weeks DEXA: dual energy x-ray absorptiometry CT: computed tomography
Experimental Design • Basal studies last 4 mornings of the study: • Palmitate flux = lipolysis (mol/min - [U13C]palmitate) • Resting energy expenditure (indirect calorimetry)
Resting Energy Expenditure vs. Free Fatty Acid Flux Women Men Palmitate release (mol/min) kcal/day Adapted from Nielsen S et al. J Clin Invest 2003; 111: 981-8
Intra-abdominal (Visceral) Fat Area vs. Residual Palmitate Flux Women Men 50 50 R esidual palmit (mol/min) Residual palmitate release 0 0 0 300 0 300 a t e r (umol/min) elease r=0.45 p<0.05 -50 -50 Intra-abdominal fat area (cm2) Intra-abdominal fat area (cm2) Adapted from Nielsen S et al. J Clin Invest 2003; 111: 981-8
Summary • Basal free fatty acid (FFA) release (lipolysis) is strongly related to resting energy expenditure. • Women have higher FFA release rates than men at comparable resting energy expenditure and comparable FFA concentrations. • This sex-based difference can only be due to increased non-oxidative FFA clearance in women. • Basal FFA release is partially modulated by body fat and catecholamine availability.
Relationship Between Body Composition and Physiological Consequences • Body fat distribution and free fatty acids (FFA) • Adipose tissue FFA release • Effects of excess FFA on health
Body Fat Distribution and Free Fatty Acids (FFA) Normal FFA High FFA
Intra-abdominal (Visceral) Fat and Upper Body Obesity Subcutaneous fat Intra-abdominal fat
Upper Body / Intra-abdominal (Visceral) Obesity and Insulin Resistance Muscle Vasculature Pancreas Liver Upper body / Intra-abdominal obesity Insulin resistance Constriction Relaxation FFA Insulin resistance Glucose release Insulin secretion
Body Fat Distribution and Free Fatty Acids (FFA) • Upper body obesity is associated with adverse metabolic consequences. • Upper body obesity is associated with high basal and postprandial FFA. • Intra-abdominal (visceral) fat most strongly correlated with metabolic abnormalities. • Do the excess FFAs come from intra-abdominal fat?
Regional Adipose Tissue Model Upper body subcutaneous fat Intra-abdominal (visceral) fat Lower body subcutaneous fat
Splanchnic Contribution to Basal Upper Body Adipose Tissue Free Fatty Acid Release * mol/min Lean women Upper body obese women Lower body obese women Adapted from Martin ML and Jensen M. J Clin Invest 1991; 88: 609-13
Regional Free Fatty Acid Release During Meal Ingestion Upper body obese Lower body obese * mol/min * * * Nonsplanchnic upper body Splanchnic Leg Nonsplanchnic upper body Splanchnic Leg * p<0.05 vs. basal values Adapted from Guo Z et al. Diabetes 1999; 48: 1586-93
Regional Free Fatty Acid Release in Obese Nondiabetics and Obese Type 2 Diabetics Percent of total Nondiabetic Diabetic Adapted from Basu A et al. Am J Physiol 2001; 280: E1000-6
Hepatic Free Fatty Acid (FFA) Delivery Women Men % Hepatic FFA delivery from intra-abdominal fat Intra-abdominal (visceral) fat area (cm2) Adapted from Nielsen S et al. J Clin Invest 2004; 113: 1582-8
Summary • Upper body subcutaneous fat accounted for the majority of systemic free fatty acid (FFA) release. • Intra-abdominal (visceral) fat mass correlated with but was not the source of most systemic FFA release. • Intra-abdominal fat mass predicts greater delivery of FFA to the liver from intra-abdominal lipolysis.
Summary • A greater portion of free fatty acid (FFA) appearance derives from leg and splanchnic adipose tissue in obese than lean men and women. • Nevertheless, the majority of systemic FFAs originate from upper body subcutaneous fat in obese men and women. • Intra-abdominal (visceral) fat correlates positively with the proportion of hepatic FFA delivery from intra-abdominal fat in both men and women.
Conclusions • In both men and women, greater amounts of intra-abdominal (visceral) fat result in a greater proportion of hepatic free fatty acid (FFA) delivery originating from intra-abdominal adipose tissue lipolysis in the overnight postabsorptive state. • This implies that arterial FFA concentrations will underestimate hepatic FFA delivery systematically and progressively with greater degrees of intra-abdominal adiposity.
Free Fatty Acids (FFA) and Pancreas Pancreas Adipose tissue Insulin resistance FFA • Long-term damage to • beta cells • Decreased insulin • secretion Short-term stimulation of insulin secretion
Free Fatty Acids (FFA) and Dyslipidemia Liver Adipose tissue Insulin resistance FFA Apo B100 synthesis and secretion VLDL-TG HDL cholesterol TG: triglycerides
Free Fatty Acids (FFA) and Glucose Production Liver Adipose tissue Insulin resistance FFA Glucose release
Free Fatty Acids (FFA) and Muscle Muscle Adipose tissue Insulin resistance FFA Insulin resistance Skeletalmusclecells Intra-muscular TG Glucose uptake TG: triglycerides
Free Fatty Acids (FFA) and Hypertension Vasculature Adipose tissue Insulin resistance FFA Constriction –greater response to alpha-adrenergic stimuli Relaxation – decreased nitric oxide generation
Summary • Upper body obesity is associated with high free fatty acids (FFA) due to excess release from upper body subcutaneous fat. • High FFA can result in: • insulin resistance in muscle and liver • VLDL TG • insulin secretion (?diabetes) • vascular abnormalities
Conclusion • Therapies that correct abnormal adipose tissue free fatty acid release may improve the metabolic abnormalities seen in upper body obesity even if weight loss is not successful.
Adipose Tissue as Endocrine Cells Angiotensinogen Resistin Retinol binding protein-4 Visfatin Interleukin-6 Tumor necrosis factor- Adiponectin Leptin
Conclusions • Fat is a dynamic and varied tissue. • Regional differences in adipose biology affect health. • The causes of differences in body fat distribution are unknown. • The relative contributions of high free fatty acids and adipokines to adverse health is unknown.