Download
1 / 9
90 likes | 186 Views
Drivers of Food Prices. Chad Hart chart@iastate.edu 515-294-9911 Iowa Hunger Summit Des Moines, Iowa October 14, 2008. The Food Dollar. Source: USDA-ERS. Farm Value in Individual Foods. Farm share of retail price 1 Food 1998 1999 2000 (Percent)

E N D
Drivers of Food Prices Chad Hart chart@iastate.edu 515-294-9911 Iowa Hunger Summit Des Moines, Iowa October 14, 2008
The Food Dollar Source: USDA-ERS
Farm Value in Individual Foods Farm share of retail price1 Food 1998 1999 2000 (Percent) Milk, ½ gal. 41 39 34 Orange juice conc., 12 fl. oz. 38 37 33 Corn, 303 can (17 oz.) 23 22 22 Applesauce, 25-oz. jar 14 14 16 Tomatoes, whole, 303 can 7 7 7 Sugar, 1 lb. 32 31 27 Flour, wheat, 5 lbs. 20 18 19 Margarine, 1 lb. 26 17 15 Rice, long grain, 1 lb. 22 19 14 Peanut butter, 1 lb. 26 23 22 Potato chips, regular, 1-lb. bag 8 9 8 Chicken dinner, fried, frozen, 11 oz. 13 13 14 Potatoes, french fried, frozen, 1 lb. 11 11 10 Bread, 1 lb. 5 5 5 Corn flakes, 18-oz. box 4 4 4 1Computed from unrounded farm values. Source: USDA-ERS
Factors Leading to Higher Commodity Prices Source: USDA-ERS, Trostle, July 2008
Events in 2007 • Droughts: • Northern Europe, Ukraine, Russia, Northwest Africa, Turkey, Australia, and Argentina • Increased export taxes: • China, Argentina, Russia, Kazakhstan, Malaysia, and Indonesia • Export restrictions: • Argentina, Ukraine, India, Vietnam, Serbia, Egypt, Cambodia, Indonesia, and Kazakhstan
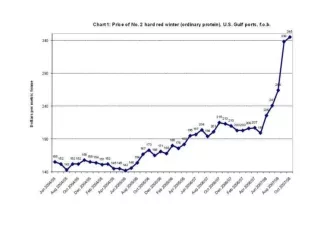
Commodity Price Indexes Source: Internation Financial Statistics