Download
1 / 9
90 likes | 208 Views
The visualization of information contained in reports is an important aspect of human-computer interaction, for both the accuracy and the complexity of relationships between data must be preserved. A greater attention has been paid to individual report visualization through different types of standard graphs (Histograms, Pies, etc.). However, this kind of representation provides separate information items and gives no support to visualize their relationships which are extremely important for most decision processes. http://kaashivinfotech.com/ http://inplanttrainingchennai.com/ http://inplanttraining-in-chennai.com/ http://internshipinchennai.in/ http://inplant-training.org/ http://kernelmind.com/ http://inplanttraining-in-chennai.com/ http://inplanttrainingchennai.com/

E N D
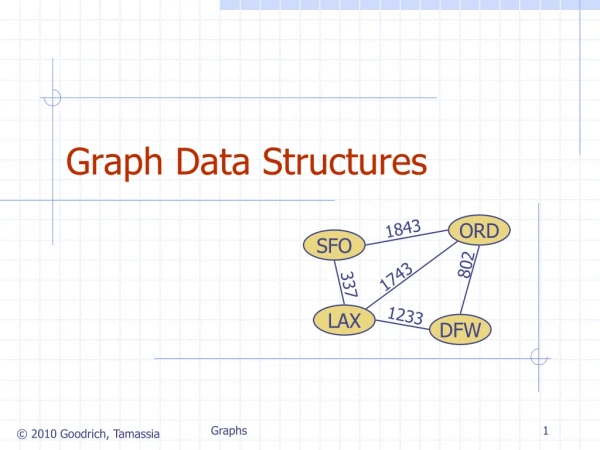
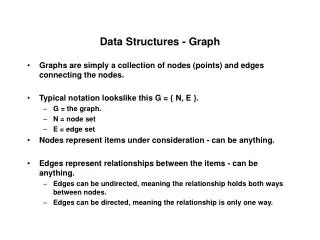
InterelatedDocumentwarehouse Report Visualisation IEEE TRANSACTIONS ON KNOWLEDGE AND DATA ENGINEERING, VOL. 26, NO. 3, MARCH 2014 “ CoDeModeling of Graph Composition for Data Warehouse Report Visualization
A Software /Manufacturing Research Company Run By Microsoft Most Valuable Professional VenkatesanPrabu .J MANAGING DIRECTOR Microsoft Web Developer Advisory Council team member and a well known Microsoft Most Valuable Professional (MVP) for the year 2008, 2009, 2010,2011,2012,2013 ,2014. LakshmiNarayanan.J GENERAL MANAGER BlackBerry Server Admin. Oracle 10g SQL Expert. Arunachalam.J Electronic Architect Human Resourse Manager
Abstract • The visualization of information contained in reports is an important aspect of human-computer interaction, for both the accuracy and the complexity of relationships between data must be preserved. A greater attention has been paid to individual report visualization through different types of standard graphs (Histograms, Pies, etc.). • However, this kind of representation provides separate information items and gives no support to visualize their relationships which are extremely important for most decision processes. • This paper presents a design methodology exploiting the visual language CoDe [1] based on a logic paradigm. CoDe allows to organize the visualization through the CoDe model which graphically represents relationships between information items and can be considered a conceptual map of the view.
Existing System • In the existing system ,data mining seeks to discover knowledge automatically in the form of statistical rules and patterns from large databases. • A data warehouse archives information gathered from multiple sources, and stores it under a unified schema, at a single site. • Important for large businesses that generate data from multiple divisions, possibly at multiple sites • First order logic algorithm has been used in the existing approach for integrating the data’s , aggregation algorithm for mining has also been implemented in our approach. • A report of data analysis will be generated from the repository of data warehoused storage ,which tends to form an knowledge cube data structure, where it denies the storage between interrelated data’s which has been proposed in our further approach. .
Proposed System • Interactive analysis of data has been proposed ,by allowing data to be summarized and viewed in different ways (Pdf,CSV,Excel,etc) with negligible delay. • Data that can be modeled as dimension attributes and measure attributes are called multidimensional data where it stores the entire data’s in the form of inter-related storage in the data warehoused repository. • Measure attributes • measure some value • can be aggregated upon • e.g. the attribute number of the sales relation,stock,etc. • Mediator based data integration algorithm has been implemented for generalization & suppression of data’s in the data warehoused paradigm ,whereas acute evasion technique to handle bulk data has been deployed further in our proposed approach.
System Requirements • Hardware Requirements: Platform : DOTNET (VS2010) , ASP.NET Dot net framework 4.0 Database : SQL Server 2008 R2 • Software Requirements: Processor : Core 2 duo Speed : 2.2GHZ RAM : 2GB Hard Disk : 160GB
Records Breaks Asia Book Of Records Tamil Nadu Of Records India Of Records MVP Awards World Record
Services: A Software /Manufacturing Research Company Run By Microsoft Most Valuable Professional Inplant Training. Internship. Workshop’s. Final Year Project’s. Industrial Visit. Contact Us: +91 98406 78906,+91 90037 18877 kaashiv.info@gmail.com www.kaashivinfotech.com Shivanantha Building (Second building to Ayyappan Temple),X41, 5th Floor, 2nd avenue,Anna Nagar,Chennai-40.

![Data Modeling [Comparison of data modeling techniques ]](https://cdn0.slideserve.com/205866/data-modeling-comparison-of-data-modeling-techniques-dt.jpg)


![Data Modeling [Comparison of data modeling techniques ]](https://cdn3.slideserve.com/6795343/data-modeling-comparison-of-data-modeling-techniques-dt.jpg)