Download

1 / 10
100 likes | 192 Views
p-Chlorobenzophenone (p-CBP) is the important chemical intermediate used for the synthesis of several pharmaceutical drugs like fenofibrate, cetirizine, alprazolam, and benzodiazepine. The aim of this study was set to evaluate the impact of biofield energy treatment on physicochemical and spectroscopic properties of p-CBP.

E N D
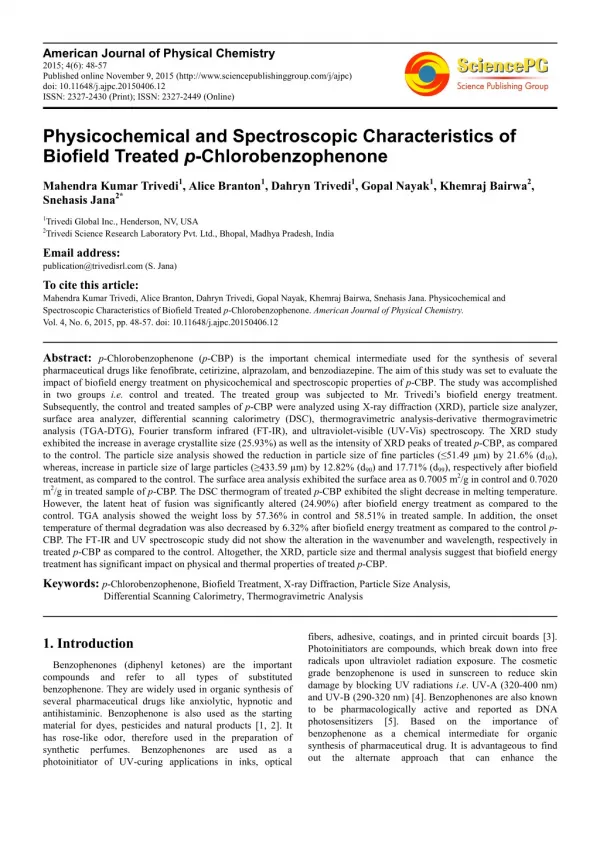
American Journal of Physical Chemistry 2015; 4(6): 48-57 Published online November 9, 2015 (http://www.sciencepublishinggroup.com/j/ajpc) doi: 10.11648/j.ajpc.20150406.12 ISSN: 2327-2430 (Print); ISSN: 2327-2449 (Online) Physicochemical and Spectroscopic Characteristics of Biofield Treated p-Chlorobenzophenone Mahendra Kumar Trivedi1, Alice Branton1, Dahryn Trivedi1, Gopal Nayak1, Khemraj Bairwa2, Snehasis Jana2* 1Trivedi Global Inc., Henderson, NV, USA 2Trivedi Science Research Laboratory Pvt. Ltd., Bhopal, Madhya Pradesh, India Email address: publication@trivedisrl.com (S. Jana) To cite this article: Mahendra Kumar Trivedi, Alice Branton, Dahryn Trivedi, Gopal Nayak, Khemraj Bairwa, Snehasis Jana. Physicochemical and Spectroscopic Characteristics of Biofield Treated p-Chlorobenzophenone. American Journal of Physical Chemistry. Vol. 4, No. 6, 2015, pp. 48-57. doi: 10.11648/j.ajpc.20150406.12 Abstract: p-Chlorobenzophenone (p-CBP) is the important chemical intermediate used for the synthesis of several pharmaceutical drugs like fenofibrate, cetirizine, alprazolam, and benzodiazepine. The aim of this study was set to evaluate the impact of biofield energy treatment on physicochemical and spectroscopic properties of p-CBP. The study was accomplished in two groups i.e. control and treated. The treated group was subjected to Mr. Trivedi’s biofield energy treatment. Subsequently, the control and treated samples of p-CBP were analyzed using X-ray diffraction (XRD), particle size analyzer, surface area analyzer, differential scanning calorimetry (DSC), thermogravimetric analysis-derivative thermogravimetric analysis (TGA-DTG), Fourier transform infrared (FT-IR), and ultraviolet-visible (UV-Vis) spectroscopy. The XRD study exhibited the increase in average crystallite size (25.93%) as well as the intensity of XRD peaks of treated p-CBP, as compared to the control. The particle size analysis showed the reduction in particle size of fine particles (≤51.49 µm) by 21.6% (d10), whereas, increase in particle size of large particles (≥433.59 µm) by 12.82% (d90) and 17.71% (d99), respectively after biofield treatment, as compared to the control. The surface area analysis exhibited the surface area as 0.7005 m2/g in control and 0.7020 m2/g in treated sample of p-CBP. The DSC thermogram of treated p-CBP exhibited the slight decrease in melting temperature. However, the latent heat of fusion was significantly altered (24.90%) after biofield energy treatment as compared to the control. TGA analysis showed the weight loss by 57.36% in control and 58.51% in treated sample. In addition, the onset temperature of thermal degradation was also decreased by 6.32% after biofield energy treatment as compared to the control p- CBP. The FT-IR and UV spectroscopic study did not show the alteration in the wavenumber and wavelength, respectively in treated p-CBP as compared to the control. Altogether, the XRD, particle size and thermal analysis suggest that biofield energy treatment has significant impact on physical and thermal properties of treated p-CBP. Keywords: p-Chlorobenzophenone, Biofield Treatment, X-ray Diffraction, Particle Size Analysis, Differential Scanning Calorimetry, Thermogravimetric Analysis fibers, adhesive, coatings, and in printed circuit boards [3]. Photoinitiators are compounds, which break down into free radicals upon ultraviolet radiation exposure. The cosmetic grade benzophenone is used in sunscreen to reduce skin damage by blocking UV radiations i.e. UV-A (320-400 nm) and UV-B (290-320 nm) [4]. Benzophenones are also known to be pharmacologically active and reported as DNA photosensitizers [5]. Based benzophenone as a chemical intermediate for organic synthesis of pharmaceutical drug. It is advantageous to find out the alternate approach that can enhance the 1. Introduction Benzophenones (diphenyl ketones) are the important compounds and refer to all types of substituted benzophenone. They are widely used in organic synthesis of several pharmaceutical drugs like anxiolytic, hypnotic and antihistaminic. Benzophenone is also used as the starting material for dyes, pesticides and natural products [1, 2]. It has rose-like odor, therefore used in the preparation of synthetic perfumes. Benzophenones are used as a photoinitiator of UV-curing applications in inks, optical on the importance of
49 Mahendra Kumar Trivedi et al.: Physicochemical and Spectroscopic Characteristics of Biofield Treated p-Chlorobenzophenone physicochemical chlorobenzophenone (p-CBP). Recently, biofield energy treatment was reported to alter the physicochemical and thermal properties of several metals [6, 7] and ceramics [8, 9]; and spectroscopic properties of various pharmaceutical drugs like chloramphenicol, tetracycline, paracetamol, and piroxicam [10, 11]. The National Institute of Health/National Center for Complementary and Alternative Medicine (NIH/NCCAM) considered the biofield energy therapy (therapy) in subcategory of energy therapies (putative energy fields) [12, 13]. The biofield energy treatment has been used in healing process to reduce pain, anxiety and to promote the overall health of human being [14, 15]. According to the Maxwell JC, the every vibrant process in the human body has an electrical significance that generates magnetic field in the human [16]. This electromagnetic field of the human body is known as the biofield and energy associated with this field is termed as the biofield energy [17, 18]. Prakash et al. reported that various scientific instruments such as Kirlian photography, resonance field imaging (RFI) and polycontrast interference photography (PIP) can be extensively used to measure the biofield of human body [19]. Thus, the human has the ability to harness the energy from the environment or Universe and transmit this energy to any living or nonliving object on the Globe. The object(s) receive the energy and respond into useful way; this process is termed as biofield treatment. Mr. Trivedi’s unique biofield energy is known as The Trivedi Effect®. Recently, the biofield energy treatment has been evaluated in several fields like biotechnology [20], microbiology [21, 22], material science [6-9], and agricultural science [23, 24]. Based on the published literature and outstanding impact of biofield energy treatment on various living and nonliving things, the present study was aimed to evaluate the impact of biofield energy treatment spectroscopic properties of p-CBP using various analytical techniques. and thermal properties of p- infrared spectroscopy. (FT-IR), and ultraviolet-visible (UV-Vis) 2.2. XRD Study XRD analysis of p-CBP was carried out on Phillips, Holland PW 1710 X-ray diffractometer with nickel filter and copper anode. X-ray wavelength used in XRD system was 1.54056 Å. The XRD diffractogram was obtained in the form of a chart of 2θ vs. intensity. The average crystallite size (G) and percent change in average crystallite size of p-CBP were calculated using the following equations [25]. Average crystallite size (G) = kλ/(bCosθ) 1 Percent change in average crystallite size (G) = [(Gt-Gc)/Gc] ×100 2 Where, Gc and Gt are average crystallite size of control and treated powder samples respectively. 2.3. Particle size Analysis The particle size of control and treated p-CBP was determined using laser particle size analyzer Sympatec HELOS-BF, with detection range of 0⋅1–875 µm. The particle size data were collected in the form of a chart of particle size vs. cumulative percentage. The particle sizes i.e. d10, d50, d90, and d99 (size below which 10%, 50%, 90%, and 99% particles are present, respectively) were computed from the particle size distribution curve. The percentage change in particle size was calculated with the help of following equation. % change in particle size,d?? ?????? ???? ?!"????? #$% ?$&' ????? #$% ?$& = × 100 3 on physicochemical and Where, (d10) Control and (d10) Treated are the particle size d10 of control and treated samples respectively. Accordingly, the percent changes in particle size i.e. d50, d90, and d99 were calculated. 2. Materials and Methods 2.4. Surface Area Analysis 2.1. Study Design Surface area of control and treated p-CBP was measured using the Brunauer–Emmett–Teller (BET) surface area analyzer, Smart SORB 90. Percent change in surface area was calculated using following equation: p-Chlorobenzophenone was procured from Sisco Research Laboratories, India. The study was carried out in two groups i.e. control and treatment. The control sample was remained as untreated; and treatment sample was handed over in sealed pack to Mr. Trivedi for biofield energy treatment under laboratory conditions. Mr. Trivedi rendered the biofield energy treatment through his unique energy transmission process i.e. thought transmission to the treatment group without touching the sample. After the biofield treatment, both the control and treated samples of p-CBP were analyzed using various analytical techniques like the X-ray diffractometry (XRD), particle size analyzer, surface area analyzer, differential scanning thermogravimetric analysis (TGA), Fourier transform ?- ???? ?!"- #$% ?$&' - #$% ?$& % change in surface area = × 100 4 Where, S Control and S Treated are the surface area of control and treated samples, respectively. 2.5. DSC Study The control and treated samples of p-CBP were studied using a Pyris-6 Perkin Elmer differential scanning calorimeter on a heating rate of 10ºC/min under air atmosphere with air flow rate of 5 mL/min. An empty pan calorimetry (DSC),
American Journal of Physical Chemistry 2015; 4(6): 48-57 50 2.7.1 FT-IR Spectroscopic Characterization FT-IR spectra of control and treated samples of p-CBP were obtained from Shimadzu’s Fourier transform infrared spectrometer (Japan) with the frequency range of 4000-500 cm-1. The analysis was accomplished to evaluate the impact of biofield energy treatment at atomic level like force constant, dipole moment, and bond strength in chemical structure [26]. sealed with cover was used as a reference pan. The melting temperature (Tm) and latent heat of fusion (∆H) were obtained from the DSC curve. 2.6. TGA-DTG Analysis The effect of biofield energy treatment on thermal properties of control and treated p-CBP were studied using Mettler Toledo simultaneous TGA-DTG. The samples were heated up to 400ºC from room temperature at the heating rate of 5ºC/min under air atmosphere. The onset temperature at which thermal degradation starts and percent change in temperature at which maximum weight loss occurs in sample were acquired from DTG thermogram. 2.7.2. UV-Vis Spectroscopic Analysis UV spectra of control and treated samples of p-CBP were acquired from Shimadzu spectrophotometer. Quartz cell with 1 cm and a slit width of 2.0 nm were used for analysis. The study was carried out at wavelength in the region of 200-400 nm. The UV spectra were analyzed to find out the effect of biofield energy treatment on the energy gap of highest occupied molecular orbital and lowest unoccupied molecular orbital (HOMO– LUMO gap) [26]. UV-2400 PC series 2.7. Spectroscopic Studies For the purpose of FT-IR and UV-Vis spectroscopic characterization, the treated sample was divided into two groups i.e. T1 and T2. Both treated groups were separately analyzed for their spectroscopic characteristics using FT-IR and UV-Vis spectroscopy and data were compared with the respective spectrum of control p-CBP sample. 3. Results and Discussion 3.1. XRD Analysis Fig. 1. XRD diffractograms of p-chlorobenzophenone.
51 Mahendra Kumar Trivedi et al.: Physicochemical and Spectroscopic Characteristics of Biofield Treated p-Chlorobenzophenone XRD diffractograms of control and treated p-CBP are shown in Fig. 1. The control p-CBP exhibited the XRD peaks at 2θ equal to 15.25º, 17.47º, 19.04º, 21.82º, 23.72º, 24.08º, 28.41º, and 29.27º. However, the XRD diffractogram of treated p-CBP showed the XRD peaks at 2θ equal to 15.22º, 17.48º, 19.04º, 21.76º, 23.66º, 24.03º, 29.21º, and 31.27º, with increased intensity of XRD peaks as compared to the control. The sharp peaks in XRD diffractogram of both control and treated samples suggest the crystalline nature of p-CBP. The increase in intensity of XRD peaks in treated sample may be attributed to enhanced crystallinity as compared to the control. It is assumed that treated p-CBP molecules absorbed biofield energy that may lead to formation of long-range symmetrical crystalline pattern as compared to the control sample. The average crystallite size was calculated using Scherrer formula and the results are shown in Fig. 2. The average crystallite size of control p-CBP was found as 83.18 nm that was increased to 104.75 nm in treated sample. The result showed about 25.93% increase in average crystallite size in treated sample as compared to the control. 489.16, 692.19 µm, respectively after biofield treatment. The results suggest that d10 and d50 particle sizes were decreased by 21.60% and 1.55% in treated p-CBP as compared to the control. Fig. 3. Particle size analysis of control and treated p-chlorobenzophenone. On the contrary, the d90 and d99 were found to increase up to 12.82% and 17.71%, in treated p-CBP respectively with respect to the control. The reduction of d10 and increase of d90 could be possible if fracturing and agglomeration took place simultaneously in treated p-CBP. Recently, our group reported the effect of biofield energy treatment on the particle size of manganese oxide [8]. It was described that finer particles get agglomerated after biofield energy treatment and lead to increase the percent of larger particle size. Thus, it is assumed that the energy, probably transferred through biofield treatment, might induce fracturing and agglomeration process in treated p-CBP, which resulted into alteration in particle sizes. Altogether, the result exhibited the alteration in the particle size of p- CBP after biofield treatment. 3.3. Surface Area Analysis Fig. 2. Crystallite size of control and treated p-chlorobenzophenone. The role of temperature on average crystallite size is well reported in the literature, which indicates that increase in temperature reduces the thermodynamically driven force. This leads to decrease in nuclear densities and thus increase in average crystallite size [27, 28]. Moreover, Gaber et al. described that elevation in processing temperature causes to decrease in dislocation density and increase in number of unit cell, which finally increased the average crystallite size [29]. Based on these, it is assumed that biofield energy treatment may provide the energy to p-CBP that causes decrease in dislocation density and increase in average crystallite size. Fig. 4. Surface area analysis of control and treated p-chlorobenzophenone. 3.2. Particle Size Analysis The surface areas of control and treated samples of p- CBP were determined using BET surface area analyzer and data are presented in Fig. 4. The control sample showed a surface area of 0.7005 m2/g; however, the treated sample showed a surface area of 0.7020 m2/g. The result showed a slight increase in surface area (0.21%) in the treated p-CBP as compared to the control. The increase in surface area The particle size was determined in four groups i.e. d10, d50, d90, and d99 (size below which 10%, 50%, 90%, and 99% particles are present, respectively) and result are presented in Fig. 3. The particle size result showed d10, d50, d90, and d99 as 51.49, 160.15, 433.59, and 588.07 µm, respectively in control sample, which were converted to 40.37, 157.66,
American Journal of Physical Chemistry 2015; 4(6): 48-57 52 might be correlated to particle size reduction in fine particle region due to high internal strain produced by biofield energy treatment [30]. The increase in surface area may lead to increase in solubility and reactivity of p-CBP as compared to the control. temperature and latent heat of fusion (∆H) of control and treated p-CBP. In solid substance, an ample amount of interaction force exists in atomic bonds that hold the atoms at their positions. The energy required to overcome the interaction force of phase change i.e. solid into liquid is known as latent heat of fusion. DSC thermogram (Fig. 5) of p-CBP showed the melting temperature at 77.57ºC in control and 76.82ºC in treated sample (Table 1). 3.4. DSC Analysis DSC analysis was performed to determine the melting Fig. 5. DSC thermograms of control and treated p-chlorobenzophenone. supported by literature data [31]. DSC thermogram exhibited the ∆Hof 113.92 J/g in control sample and 85.55 J/g in treated sample of p-CBP. The result showed 24.90% decrease in ∆H of treated sample as compared to the control. It is presumed that, biofield energy treatment probably supplied the energy to treated sample that is stored in the form of potential energy. Therefore, it required less energy during phase change due to the high-energy state of biofield treated samples. Previously, our group has reported that biofield energy treatment altered the value of ∆H in lead and tin powders [6]. Therefore, it is assumed that biofield energy treatment might change the intermolecular interaction of treated p-CBP that may lead to decrease the ∆H. Table 1. Thermal analysis of control and treated samples of p- chlorobenzophenone. Parameter Latent heat of fusion (J/g) Melting point (ºC) Onset temperature (ºC) End-set temperature (ºC) Tmax (ºC) Control 113.92 77.57 190 230.5 207.51 Treated 85.55 76.82 178 238 206.33 Tmax: temperature at maximum weight loss occurs The result showed about 0.97% decrease in melting temperature in treated sample of p-CBP as compared to the control. The melting temperature of control p-CBP was well
53 Mahendra Kumar Trivedi et al.: Physicochemical and Spectroscopic Characteristics of Biofield Treated p-Chlorobenzophenone 3.5. TGA-DTG Analysis temperature by 3.25% in treated sample of p-CBP as compared to the control. The DTG thermogram exhibited the maximum thermal decomposition temperature (Tmax) at 207.51°C in control sample and at 206.33°C in treated sample of p-CBP. The result revealed about 0.57% decrease in Tmax of treated sample with respect to the control. The decrease in Tmax of treated sample might be correlated with increase in vaporization or volatilization of treated p- CBP after biofield treatment. It might be due to alteration in internal energy through biofield energy treatment that results into earlier vaporization as compared to the control. The TGA and DTG thermogram of control and treated samples of p-CBP are shown in Fig. 6 and data are reported in Table 1. TGA thermogram of control p-CBP showed the onset temperature around 190.0°C, while the end-set temperature was observed at 230.5°C with 57.36% weight loss. However, the treated p-CBP started losing weight around 178°C and the end-set was observed at 238°C with 58.52% weight loss (Fig. 6). The result showed the decrease in onset temperature by 6.32% and increase in end-set Fig. 6. TGA-DTG thermograms of control and p-chlorobenzophenone. aromatic C-H stretching peak was assigned at 3063 cm-1 in all three samples i.e. control and treated (T1 and T2). Likewise, the aromatic C-H in-plane deformations were attributed to peaks 1089-1145 cm-1 in control and 1089-1147 cm-1 in treated (T1 and T2) samples. The C-H out of plane deformations were observed at frequency region of 729-844 3.6. FT-IR Spectroscopic Analysis FT-IR spectra of control and treated samples of p-CBP (Fig. 7) were interpreted based on the theoretically predicted wavenumber.The chemical structure of p-CBP showed mainly C=O, C=C, C-C, C-H groups vibrational peaks. The
American Journal of Physical Chemistry 2015; 4(6): 48-57 54 cm-1 in all three samples (control, T1 and T2). The vibrational peak of ketone (C=O) groups generally appears around 1715 cm-1 [32]. However, in p-CBP, it was appeared at 1651 cm-1 in control and T2 samples, whereas in T1 sample it appeared at 1649 cm-1. This decreased wavenumber of C=O stretching in all three samples was observed due to extended resonance effect that lower the force constant and thus wavenumber of C=O group stretching. The aromatic C=C stretchings were attributed to vibrational peaks observed at 1400-1585 cm-1 in control and 1400-1583 cm-1 in treated samples (T1 and T2). Similarly, the C-C stretching peak was appeared at 1284 cm-1 in control and T2 samples and at 1282 cm-1 in T1 sample of p-CBP. Fig. 7. FT-IR spectra of control and treated (T1 and T2) p-chlorobenzophenone. Overall, the FT-IR result suggests that the biofield energy treatment did not exhibit the alteration in the wavenumber of any bond in treated p-CBP as compared to the control.
55 Mahendra Kumar Trivedi et al.: Physicochemical and Spectroscopic Characteristics of Biofield Treated p-Chlorobenzophenone 3.7. UV-Vis Spectroscopy nm in T2. Overall, the UV spectral analysis suggests that biofield energy treatment may not cause any significant alterations in the λmax of treated p-CBP samples with respect to the control. Altogether, the UV and FT-IR results, suggest that structural properties of treated p-CBP remained same as control. The UV spectra of control and treated p-CBP are shown in Fig. 8. UV spectrum of control p-CBP exhibited the absorbance maxima (λmax) at 205.0 and 257.6 nm. A similar pattern of λmax was observed in both the treated samples (T1 and T2) i.e. at 205.0 and 257.8 nm in T1 and 203.5 and 257.5 Fig. 8. UV spectra of control and treated (T1 and T2) p-chlorobenzophenone. the ∆H was significantly changed by 24.9% in treated sample as compared to the control. The spectroscopic analysis (FT- IR and UV-Vis) suggest that biofield energy treatment did not affect the structural properties of treated sample as compared to the control. Altogether, it is concluded that the biofield energy treatment has the impact on physicochemical and thermal properties of treated p-CBP with respect to the control. Based on this, it is assumed that biofield treated p-CBP could be more useful as chemical intermediate for organic synthesis of various pharmaceutical drugs. 4. Conclusion In summary, the XRD diffractogram of biofield treated p- CBP exhibited the increase in intensity of the XRD peaks as well as the average crystallite size (25.93%) as compared to the control. The particle size analysis suggests the decrease in particle size of fine particles (d10) and increase in particle size of the large particles (d90 and d99) with respect to the control sample. The surface area analysis showed the slight increase in the surface area of the treated p-CBP with respect to the control. The thermal analysis (DSC, TGA/DTG) showed a slight decrease in melting temperature and Tmax. However,
American Journal of Physical Chemistry 2015; 4(6): 48-57 56 Abbreviations Spectroscopic characterization of chloramphenicol and tetracycline: An impact of biofield. Pharm Anal Acta 6: 395. p-CBP: para-Chlorobenzophenone; NIH: National Institute of Health; NCCAM: National Center for Complementary and Alternative Medicine; XRD: X-ray diffraction; DSC: Differential scanning calorimetry; TGA: Thermogravimetric analysis; DTA: Differential thermal analysis; DTG: Derivative thermogravimetric analysis; FT-IR: Fourier transform infrared; UV-Vis: Ultraviolet-visible [11]Trivedi MK, Patil S, Shettigar H, Bairwa K, Jana S (2015) Effect of biofield treatment on spectral properties of paracetamol and piroxicam. Chem Sci J 6: 98. [12]Koithan M (2009) Introducing complementary and alternative therapies. J Nurse Pract 5: 18-20. [13]Hok J, Tishelman C, Ploner A, Forss A, Falkenberg T (2008) Mapping patterns of complementary and alternative medicine use in cancer: an explorative cross-sectional study of individuals with reported positive "exceptional" experiences. BMC Complement Altern Med 8: 48. [14]Aldridge D (1991) Spirituality, healing and medicine. Br J Gen Pract 41: 425-427. Acknowledgement [15]Cahil M (1998) Nurses handbook of complementary and alternative therapies. Springhouse, Corporation. The authors would like to acknowledge the Trivedi Science, Trivedi Master Wellness and Trivedi Testimonials for their steady support during the work. Authors would also like to thanks the whole team of MGV pharmacy college, Nashik for providing the instrumental facility. PA: Springhouse [16]Maxwell electromagnetic field. Phil Trans R Soc Lond 155: 459-512. JC (1865) A dynamical theory of the [17]Rubik B (2002) The biofield hypothesis: Its biophysical basis and role in medicine. J Altern Complement Med 8: 703-717. References [18]Rivera-Ruiz M, Cajavilca C, Varon J (2008) Einthoven's String Galvanometer: The first electrocardiograph. Tex Heart Inst J 35: 174-178. [1]Bezwada INDOFINE Chemical Company Hillsborough, NJ, USA. http://indofinechemical.com/resources/white- papers/Chemistry_of_Benzophenones[44WHD97].pdf. RS (2008) Chemistry of benzophenones. [19]Prakash S, Chowdhury AR, Gupta A (2015) Monitoring the human health by measuring the biofield "aura": An overview. IJAER 10: 27637-27641. [2]Thakur VK (2014) Lignocellulosic polymer composites: Processing, characterization, and properties. John Wiley & Sons, MA, USA. [20]Nayak G, Altekar N (2015) Effect of biofield treatment on plant growth and adaptation. J Environ Health Sci 1: 1-9. [3]Thenmozhi R, Claude A (2012) Rapid crystal growth of benzophenone by low temperature solution growth and its characterization. Archives Appl Sci Res 4: 898-905. [21]Trivedi MK, Bhardwaj Y, Patil S, Shettigar H, Bulbule A (2009) Impact of an external energy on Enterococcus faecalis [ATCC-51299] in relation to antibiotic susceptibility and biochemical reactions-an experimental study. J Accord Integr Med 5: 119-130. [4]Latha MS, Martis J, Shobha V, Sham Shinde R, Bangera S, et al. (2013) Sunscreening agents: A review. J Clin Aesthet Dermatol 6: 16-26. [22]Trivedi MK, Patil S, Shettigar H, Mondal SC, Jana S (2015) Evaluation of biofield modality on viral load of Hepatitis B and C viruses. J Antivir Antiretrovir 7: 83-88. [5]Cuquerella MC, Lhiaubet-Vallet V, Cadet J, Miranda MA (2012) Benzophenone photosensitized DNA damage. Acc Chem Res 45: 1558-1570. [23]Shinde V, Sances F, Patil S, Spence A (2012) Impact of biofield treatment on growth and yield of lettuce and tomato. Aust J Basic Appl Sci 6: 100-105. [6]Trivedi MK, Patil S, Tallapragada RM (2013) Effect of bio field treatment on the physical and thermal characteristics of silicon, tin and lead powders. J Material Sci Eng 2: 125. [24]Sances F, Flora E, Patil S, Spence A, Shinde V (2013) Impact of biofield treatment on ginseng and organic blueberry yield. Agrivita J Agric Sci 35. [7]Trivedi MK, Patil S, Tallapragada RMR (2015) Effect of biofield treatment on the physical and thermal characteristics of aluminium powders. Ind Eng Manage 4: 151. [25]Patterson AL (1939) The Scherrer formula for X-ray particle size determination. Phys Rev 56: 978-982. [8]Trivedi MK, Nayak G, Patil S, Tallapragada RM, Latiyal O (2015) Evaluation of biofield treatment on physical, atomic and structural characteristics of manganese (II, III) oxide. J Material Sci Eng 4: 177. [26]Pavia DL, Lampman GM, Kriz GS (2001) Introduction to spectroscopy. (3rdedn), Thomson Learning, Singapore. [27]Rashidi AM, Amadeh A (2009) The effect of saccharin addition and bath temperature on the grain size of nanocrystalline nickel coatings. Surf Coat Technol 204: 353-358. [9]Trivedi MK, Nayak G, Patil S, Tallapragada RM, Latiyal O (2015) Studies of the atomic and crystalline characteristics of ceramic oxide nano powders after biofield treatment. Ind Eng Manage 4: 161. [28]Gusain D, Srivastava V, Singh VK, Sharma YC (2014) Crystallite size and phase transition demeanor of ceramic steel. Mater Chem Phys 145: 320-326. [10]Trivedi MK, Patil S, Shettigar H, Bairwa K, Jana S (2015)
57 Mahendra Kumar Trivedi et al.: Physicochemical and Spectroscopic Characteristics of Biofield Treated p-Chlorobenzophenone [29]Gaber A, Abdel-Rahim MA, Abdel-Latief AY, Abdel-Salam MN (2014) Influence of calcination temperature on the structure and porosity of nanocrystalline SnO2 synthesized by a conventional precipitation method. Int J Electrochem Sci 9: 81- 95. morphological properties of silicon carbide. J Powder Metall Min 4: 132. [31]Dewan A, Kakati DK (2007) Regeneration of carbonyl compounds from their oximes using Ce(IV) based phase- transfer oxidants. Indian J Chem Technol 14: 635-637. [30]Trivedi MK, Nayak G, Tallapragada RM, Patil S, Latiyal O, et al. (2015) Effect of biofield treatment on structural and [32]Smith BC (1998) Infrared Spectral Interpretation: A systematic approach. CRC Press.