Download
1 / 30
300 likes | 304 Views
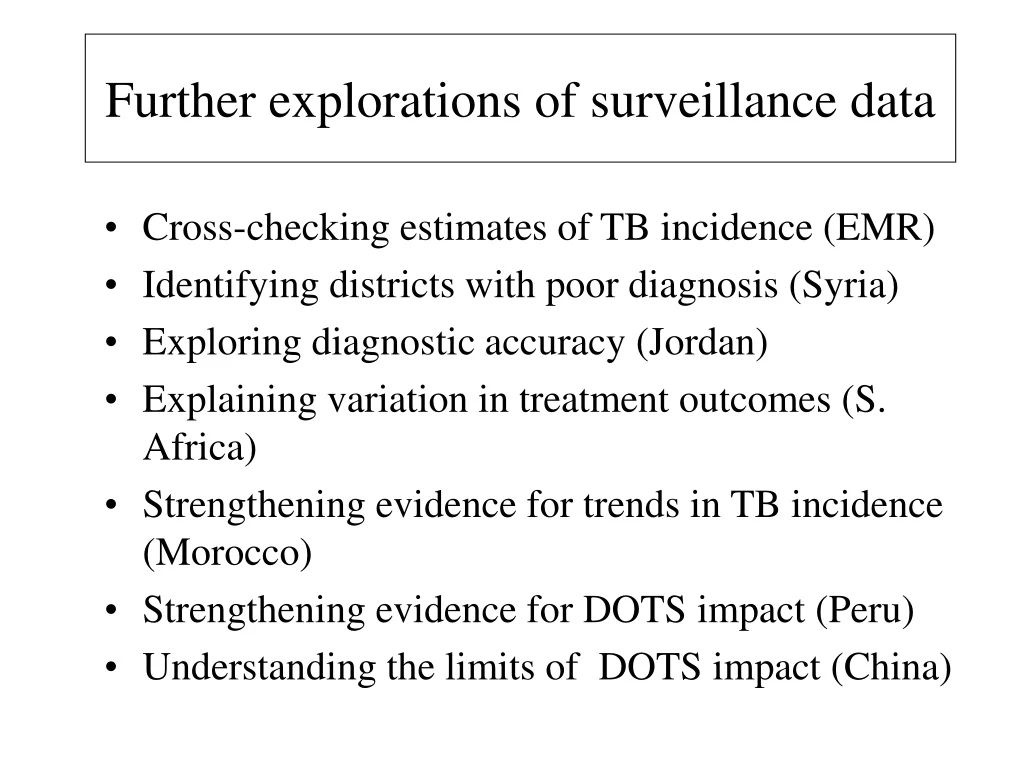
Further explorations of surveillance data. Cross-checking estimates of TB incidence (EMR) Identifying districts with poor diagnosis (Syria) Exploring diagnostic accuracy (Jordan) Explaining variation in treatment outcomes (S. Africa) Strengthening evidence for trends in TB incidence (Morocco)

E N D
Further explorations of surveillance data • Cross-checking estimates of TB incidence (EMR) • Identifying districts with poor diagnosis (Syria) • Exploring diagnostic accuracy (Jordan) • Explaining variation in treatment outcomes (S. Africa) • Strengthening evidence for trends in TB incidence (Morocco) • Strengthening evidence for DOTS impact (Peru) • Understanding the limits of DOTS impact (China)
Standards and norms in TB epidemiology: 2 approaches 1. Comparisons with known standards e.g. • ss+ inc = 50 * ARTI (Styblo) • ss+/pulmonary cases = 70% • EP/all TB = 15-20% 2. Anomalies, deviations, and inconsistencies: • incidence inversely related to average age • regional variation in sex ratio • provincial differences in suspects/cases See indicator list
Smear-positive diagnosis by province, Syria 1.0 0.9 0.8 0.7 0.6 ss+/all pulmonary 0.5 0.4 0.3 0.2 0.1 0.0 A Ar D H I K L M OS Q R RD S SW T Z
TB suspects by province: Jordan 7000 6000 5000 4000 Suspects/100,000 population 3000 2000 1000 0 SALT IRBID MA'AN ZARKA KARAK AMMAN AQAUBA TAFILAH MAFRAQ MADABA
Compliance with treatment, Hlabisa, South Africa 1 0.9 treatment Probability of remaing on 0.8 Clinic Volunteer 0.7 CHW 0.6 0 15 30 45 60 75 90 105 120 135 150 165 180 Days
Compliance with short-course chemotherapy 1 0.9 proportion remaining 0.8 compliant 0.7 0.6 0.5 0 1 2 3 4 5 6 months Yougelson & Joubert, SAMJ 1991
Changing aetiology of tuberculosis Netherlands model, 45-49 yr-olds 160 140 progressive primary 120 100 exogenous reinfection Incidence rate/100K/year 80 endogenous reactivation 60 40 20 0 1950 1953 1956 1959 1962 1965 1968 1971 1974
Reward for diagnostic effort: Peru 0.04 0.03 0.02 Increase in notification rate/increase in smear exam rate 0.01 0 -0.01 92-93 93-94 94-95 95-96 96-97 97-98 98-99 Years compared
Source of retreatment patients Changshou County, China 70 60 n = 288 50 40 percentage 30 20 10 0 out of county in county, out in project project