Download
1 / 9
120 likes | 136 Views
3.2 Families of Graphs. Learning Target: I can identify the transformations of simple graphs. I can sketch graphs of related function. Family of graphs – a group of graphs that displays one or more similar characteristics.

E N D
Learning Target: • I can identify the transformations of simple graphs. • I can sketch graphs of related function
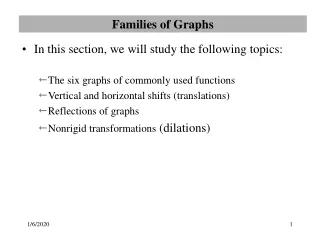
Family of graphs – a group of graphs that displays one or more similar characteristics • Parent graph – basic graph that is transformed to create other members in a family of graphs. • Reflections and translations of the parent function can affect the appearance of the graph. The transformed graph may appear in a different location but it will resemble the parent graph.
Reflection – flips a figure over a line called the axis of symmetry. y = -f(x) is reflected over the x-axis. y = f(-x) is reflected over the y-axis.
Translations – when a constant c is added or subtracted from a parent function, the result f(x) + or – c, is a translation of the graph up or down. • When a constant c is added or subtracted from x before evaluating a parent function, the result f(x + or – c) is a translation left or right. • y = f(x) + c: up c • y = f(x) – c: down c • y = f(x + c): left c • y = f(x – c): right c
Dilation – shrinking or enlarging a figure • When the leading coefficient of x is not 1, the function is expanded or compressed • y = c(f(x)), c >1: expands vertically • y = c(f(x)), 0<c<1: compresses vertically • y = f(cx), c >1: compresses horizontally • y = f(cx), 0<c<1: expands horizontally
Ex 3Use the parent graph y = x3 to graph the following: y = x3 – 1 y = (x – 1)3 y = (x – 1)3 + 3