Download
1 / 21
210 likes | 213 Views
Assessing The Real Impact of 802.11 WLANs: A Large-Scale Comparison of Wired and Wireless Traffic. Maria Papadopouli * Assistant Professor Department of Computer Science University of North Carolina at Chapel Hill (UNC).

E N D
Assessing The Real Impact of 802.11 WLANs:A Large-Scale Comparison of Wired and Wireless Traffic Maria Papadopouli * Assistant Professor Department of Computer Science University of North Carolina at Chapel Hill (UNC) * This work was partially supported by the IBM Corporation under an IBM Faculty Award 2004 It was done while visiting theInstitute of Computer Science, Foundation for Research and Technology-Hellas, Greece
Collaborators & Coauthors Felix-Hernandez Campos Department of Computer Science University of North Carolina at Chapel Hill (UNC)
Roadmap • Motivation & Research Objectives • Testbed & Data Acquisition • Data Analysis • Contributions • Future Work
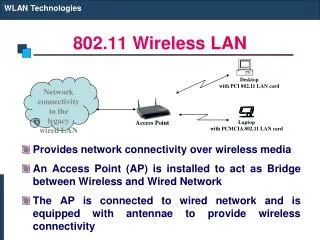
Motivation • Increasingly deployment of 802.11 wireless networks • Plethora of novel research issues such as mobility, power management, capacity planning, QoS support • Need for benchmarks • More accurate and realistic characterizations of production wireless networks & their performance • More representative assumptions in theoretical & simulations studies
Research Objectives • Characterize packet-level performance • volume • packet loss • unnecessary retransmissions • delay • Contrast • wireless vs. wired • WAN vs. LAN • Perform large-scalepassive measurements
Testbed & Data Set • 729-acre campus: 26,000 students, 3,000 faculty, 9,000 staff • Diverse environment • 14,712 unique MAC addresses • 488 APs (Cisco 1200, 350, 340 Series) • 175 GB packet headers in a 7-day trace • 9,766,507 TCP connections from wired clients • 21,396,174 TCP connectionsfrom wireless clients • ~ 33% of the connections: pathological cases with no useful payload (~0.1% of bytes) • Wireless/wired TCP connections carried ~500GB (each)
TCP Connection Payload (Bytes)Wired Clients vs. Wireless Clients Wired Clients Wireless Clients
TCP Connection Payload (Bytes) Download Upload
Connections with 100 packets represent < 5% of all connections but carry > 85% of the total bytes ≥ Connection Size (# Packets)
One-Side Transit Time Measurement WAN OSTT LAN OSTT
Minimum One-Side Transit Time Wired LAN [0.7ms, 1ms] Wireless LAN [1ms,7ms] [7ms, 250ms] WAN [6ms,250ms]
One-Side Transit Time Statistics Wireless LAN Wired LAN Heavy max & avg
Maximum One-Side Transit Time Wired Clients Wireless Clients TCP delay ACK mechanism introduces extra delays of ~ [100ms, 200ms]
Large Delay Variability on Wireless LAN Wired LAN mad Wireless LAN mad
Fraction of Round-Trip Time from LANUsing Medians & Means Wired Clients Wireless Clients Using medians
Packet Losses Computed based on retransmissions and triple duplicate ACKs (3DUP) • 2% losses were observed for • 17% of the connections for wired clients • 23% of the connections for wireless clients • 802.11 link layer retransmission is very effective • The high delay variability suggests that several losses were recovered • They may be higher under special conditions Client mobility High traffic load at AP
Unnecessary Retransmissions (% Tot. Pck) 100+ connections Wired Clients Enough samples for a more conservative timeout that reduces the # of unnecessary retransmissions Wireless Clients
Contributions • Large-scale passive measurement study on TCP connection characteristics on • volume • delays • losses • unnecessary retransmissions • lack of termination Wireless vs. Wired LANs • Wireless LANs have • substantially higher delay variability • significant more unnecessary retransmissions • only marginally greater packet losses
Future Work • Characterization of wireless flows under certain conditions (mobility, application, AP, time) • Flow modeling • Forecasting traffic load using flow-related information • Contrast connection models from different wireless environments (campus, institute, metropolitan area, conference) UNC/FORTH Data repository with traces & models
More Info • http://www.cs.unc.edu/~maria • http://www.ics.forth.gr/mobile/ • maria@cs.unc.edu Thank You!