Download
1 / 9
90 likes | 261 Views
Bright, Brighter, Brightest. By Cecsily Bianchi, Ashley Villagomez, Rob Rushing and Kyle Dolezal. Summary of Lab.

E N D
Bright, Brighter, Brightest By Cecsily Bianchi, Ashley Villagomez, Rob Rushing and Kyle Dolezal
Summary of Lab We were placed in a dark small room with a three-stage light bulb. We connected a calculator to a machine that would collect the data. Every three seconds someone would turn the light bulb to the next stage. At each stage the light would become brighter. You would do this until the bulb is at the final stage. When you reconnect your calculator the data will be transferred, displaying a 4 stage step graph with all the needed information.
Data Variables In this lab time is the independent variable and brightness is the dependent variable. A total of 99 points of data were recorded throughout the experiment
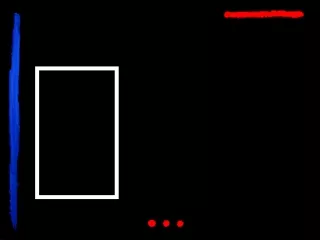
Graph-Step Function (Greatest Integer) f(x) = .07519[ ⅓(x)] + .00714 If we wanted to make the steps longer, we could’ve kept the light bulb on at the same brightness for a longer period of time. If we wanted to make the steps further apart, we could’ve increased the wattage difference between each brightness level. Graph Key: RED: This is the distance between each step. BLUE: This is the horizontal stretch of each step. GREEN: This is the ambient light value.
What we learned Our grouped learned the meaning of ambient lighting. Ambient light was the light that is present in our data room even when the lights were off and the door was door closed. The light coming through the window and cracks in the door was the ambient light in this activity. We also learned how to subtract this ambient light from our data to measure the actual brightness of the light bulb (in watts).
Calculations without ambient light For every brightness setting (low, medium, high) we had to subtract the amount of ambient light we measured (.00714 watts). Using the brightness calculations excluding ambient light, we found the ratios from high to medium (1.4312 watts), medium to low (2.2567 watts), and high to low (3.2298 watts). Then, we read the brightness values directly off of the light bulb to tell us the amount of watts per level brightness (low=50 watts, medium=100 watts, high=150 watts) and calculate the ratios from high to medium (1.5 watts), medium to low (2 watts), and high to low (3 watts).
Comparing results Since we subtracted ambient light from our recorded brightness at high, medium, and low, the ratios of the different brightness levels we measured and the ratios of the watts of the light bulb were almost equal. This proves that our data was nearly perfect.
Problems During this activity the main challenge we faced was getting accurate data when having ambient light coming through the window and cracks in the door. Even with the ambient light it was still dark enough for us to run into difficulties trying to take data when we could barely see. In the end we recorded data for several trials to ensure that we had accurate data.