Download
1 / 25
250 likes | 371 Views
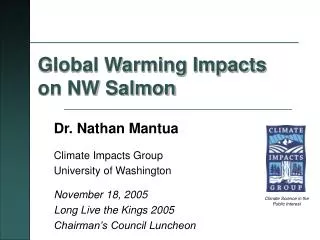
Global Warming and NW salmon. 3 major questions: How well do we understand the climate system and our role in changing it? What might the regional impacts of global warming look like? What does the answer to question 2 mean for NW salmon?. Earth’s Natural Greenhouse Effect. Some facts.

E N D
Global Warming and NW salmon 3 major questions: • How well do we understand the climate system and our role in changing it? • What might the regional impacts of global warming look like? • What does the answer to question 2 mean for NW salmon?
Some facts • Earth’s natural greenhouse effect warms surface temperatures by ~33ºC (60 º F) • H2O vapor the most powerful greenhouse gas (GG) • other important GG’s are CO2, CH4, N2O, HFCs, PFCs, and SF6 … • Human caused emissions of these GG’s are increasing the natural greenhouse effect • Without drastic changes in current emissions trends, GG concentrations will increase dramatically in the next few centuries
Concentrations of Carbon Dioxide and Methane Have Risen Greatly Since Pre-Industrial Times Carbon dioxide: 33% rise Methane: ~150% rise The MetOffice. Hadley Center for Climate Prediction and Research.
Long-term CO2 history • from a very long term perspective, recent CO2 changes are enormous
Annual Temperature Trends, (°C / century) 1901-1999 PNW average temperatures have risen +1.5F/century Source: P. Jones, et. al. 2000.
Trends in April 1 snow water equivalent, 1950-2000 Trends in snowmelt runoff timing, 1948-2000 Courtesy of Dan Cayan, Scripps Institute of Oceanography and the USGS To appear in Climatic Change, 2003 Courtesy of Phil Mote, UW Climate Impacts Group Geophysical Res. Letts. 2003
The South Cascade glacier retreated dramatically in the 20th century Blue Glacier length, Olympic National Park 1928 Courtesy of Ed Josberger, USGS glacier group 2000
Looking to the future… • “global climate system models” now used to assess the impacts of human activities on Earth’s climate • Similar to the computer models used to predict the weather, but much more sophisticated • simulate interactions between the atmosphere, its constituents (C02, O2, O3, N2 …), the ocean, sea ice, vegetation, and clouds
~1.5 to 3°C or ~ 3 to 6 °F warmer in the 2040’s Most models also simulate slightly wetter winters
The main impact: less snow } for a ~ 4F warming Snoqualmie Pass 3022 ft
April 1st Snowpack simulations based on a low-end warming scenario 1950-99 2050’s 2090’s Provided by Dennis Lettenmaier and Andy Wood, UW Civil Engineering Accelerated Climate Prediction Initiative, a UW-SIO-PNNL collaboration
Runoff patterns are temperature and elevation dependent Puget Sound Precip a warmer climate Skagit 1900’s Oct Feb Jun Oct Feb Jun Puyallup Oct Feb Jun Skokomish Oct Feb Jun
Climate and Salmon habitat Streams:Higher flows during incubation periods; Lower flows, higher temperatures during summer/fall rearing and spawning; INCREASED STRESS estuaries: higher temperatures and migration barriers; INCREASED STRESS; impacts on predator/prey fields??? ocean: warming and stratification limits nutrients, warmer temperatures alter predator/prey fields; INCREASED STRESS upwelling winds???
Thermal limits in freshwater habitat Figure 16: Future Status of Salmon Habitat (CGCM 2 Model with A2 Emissions) Use output from climate model scenarios (summertime air temperature change) to model stream temperature changes, compare with known water temperature limits • Lost by 2030 • Lost by 2060 • Lost by 2090 From Defenders of Wildlife and Natural Resources Defense Council, 2002: Effects of Global Warming on Trout and Salmon in US Streams
Freshwater thermal limits: habitat change by species (DFW/NRDC 2002) Based on 8 different climate change scenarios (combinations of 3 different models and 4 different emissions scenarios)
upwelling food webs and environmental change in our coastal ocean: the California Current Cool water, weak stratification high nutrients, a productive “subarctic” food-chain with abundant forage fish and few warm water predators Warm stratified ocean, few nutrients, low productivity “subtropical” food web, a lack of forage fish and abundant predators Progress in Oceanogr., 54 (2002)
High Seas Habitat? Sea surface temperatures and catch-per-unit-effort (cpue) for steelhead (O. mykiss) on the high seas: cpue peaks between 6 and 11ºC(Burgner et al. 1992, INPFC)
Welch et al’s (1998) Thermal Limits 1. Salmon are surface oriented 2. They are metabolically constrained by surface ocean temperatures 3. Surface ocean warming will force salmon (sockeye and steelhead) out of the Pacific and into cooler northern oceans as metabolic rates accelerate with warming
December 2xCO2 distribution 20th Century distribution Sockeye salmon distribution (Welch et al 1998) July
Temperature tag data from an adult Copper River (Alaska) fall run steelhead, 1998age 2.3, spawning check at second ocean annulus High seas, to 40-60m depths Coastal Alaska current Chart provided by Kate Myers, UW FRI High Seas salmon program
future climate scenarios: different model - emissions combinations give different answers 6 C model uncertainty Emissions uncertainty Temperature Change (C) 1.5 C
What might climate change look like in the Northwest? Considering 10 scenarios of future climate, the average changes from baseline: • 1.7°C (3.1°F) warmer by 2020s • 2.9°C (5.3°F) warmer by 2050s • Warming similar in winter and summer • Wetter winters (almost all models) • Summer rainfall? • models divided, but all uphold strong seasonality
Millennial Northern Hemisphere (NH)Temperature Reconstruction (blue) and Instrumental Data (red) fromAD 1000-1999 Source: Mann et al. 1999.