Download
1 / 37
370 likes | 450 Views
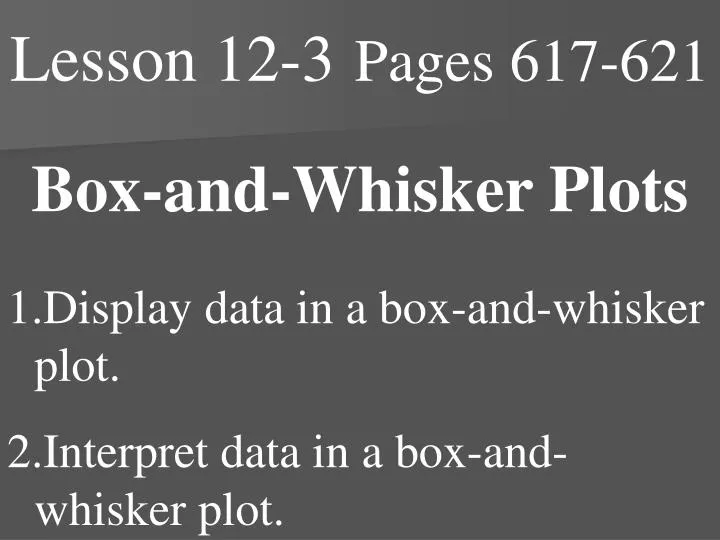
Lesson 12-3 Pages 617-621. Box-and-Whisker Plots. Display data in a box-and-whisker plot. Interpret data in a box-and-whisker plot. What you will learn!. How to display data in a box-and-whisker plot. How to interpret data in a box-and-whisker plot. Vocabulary.

E N D
Lesson 12-3Pages 617-621 Box-and-Whisker Plots • Display data in a box-and-whisker plot. • Interpret data in a box-and-whisker plot.
What you will learn! • How to display data in a box-and-whisker plot. • How to interpret data in a box-and-whisker plot.
What you really need to know! A box-and-whisker plot divides a set of data into four parts using the median and quartiles. Each of these parts contain 25% of the data.
What you really need to know! Lower Quartile Upper Quartile Lower Extreme Upper Extreme Median
Example 1: The projected number of employees in 2008 in the fastest growing occupation is shown in the table below. Display the data in a box and whisker plot.
LQ is 187.5 UQ is 1,024 Lower half of data Upper half of data Median between 398 and 622. 398 + 622 = 1,020 1,020 ÷ 2 = 510
1,024 187.5 44 1,194 510
Example 2: The box-and-whisker plot below shows the average percent of sunny days per year for selected cities in each state.
Example 2: What is the smallest percent of sunny days in any state? 23%
Example 2: Half of the selected cities have an average of sunny days under what percent? 56%
Example 2: What does the length of the box in the plot tell us about the data? Since the box is short, the data is clustered together!
Example 3: The average maximum height, in feet, for selected evergreen and deciduous tress is displayed. How do the heights of evergreen tress compare with the heights of deciduous trees? Most evergreen trees are taller than most deciduous trees. Deciduous Trees Evergreen Trees
Page 619-620 Guided Practice #’s 4-9
Read: Pages 617-619 with someone at home and study examples!
Homework: Pages 620-621 #’s 10, 12, 14, 16, 17 #’s 22, 23, 26-29 Lesson Check 12-3
Page 753 Lesson 12-3