Download
1 / 10
100 likes | 205 Views
Improving Green Space: Making the Most of the Development Process Percentage returned, including follow up telephoning 43% Percentage returned, excluding county councils 53% Percentage of those responding with a Green Space Strategy 46%

E N D
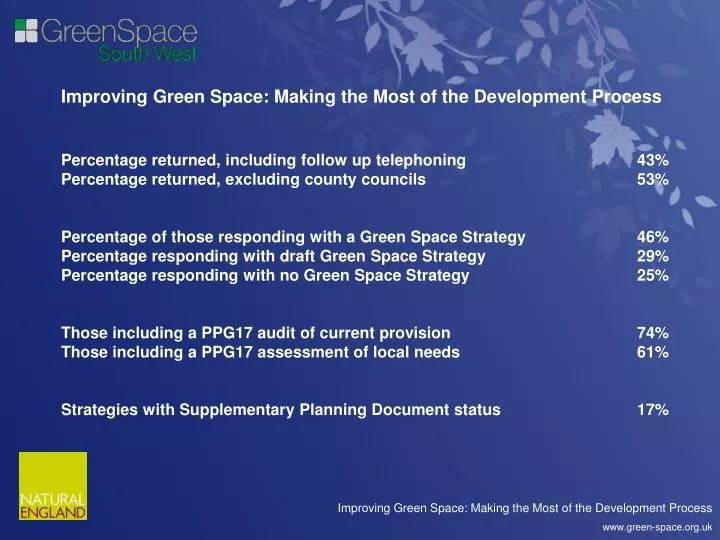
Improving Green Space: Making the Most of the Development Process Percentage returned, including follow up telephoning 43% Percentage returned, excluding county councils 53% Percentage of those responding with a Green Space Strategy 46% Percentage responding with draft Green Space Strategy 29% Percentage responding with no Green Space Strategy 25% Those including a PPG17 audit of current provision 74% Those including a PPG17 assessment of local needs 61% Strategies with Supplementary Planning Document status 17%
Strategies that sit within a wider, enabling framework 66% • Broken down as follows: • Local Development Framework 43% • Regional Green Infrastructure Strategy 19% • Sub-regional Green Infrastructure Strategy 14% • Corporate Plan 38% • Community Strategy 33% • Sustainable Community Strategy 19% • Local Area Agreement 24% • Other strategies: Biodiversity, Sport, Recreation and Play, Leisure, Sustainability
Ability to spend contributions on site 91% Ability to spend contributions off site 89% Authorities that link location and type of contribution to strategy 50% Other criteria include: Consultation with members, officers and community SPD adopted, local plan used, formula based, not locational Those that gain contributions from non residential development 44% The other development includes: Hotels, guest houses, urban commercial, where a landscape contribution is a planning requirement
Exemptions Policies with specific developments exempted: 67% Types of development exempted: Sheltered housing, nursing homes, student accommodation, one bedroom properties, affordable housing Minimum thresholds Respondents showed a wide variation, including: 5 dwellings, 1 property, any development, 4 houses, 1 bed increase, commercial over 2000m², 6 dwellings, 7 units, 10 dwellings or 0.1ha.
Authorities using established formula for calculating contributions 83% Authorities using unit costs to calculate contributions 67% Authorities using commuted sums to cover maintenance 78% Breakdown of years: 10 to 14 years 35% 15 to 19 years 35% 20 years 30% Authorities using contributions to fund internal or external staff 54% Examples include 106 administration, green space projects, design
Standards Authorities using national standards in their Strategies 27% (all National Playing Fields Association 6 acre standard) Authorities using local standards 50% Authorities using Accessible Natural Green Space Standards 0% Authorities keeping a record of: Geographical area of need 55% Progress towards achieving the standard 50% (75% of these using GIS)
Percentage of authorities prioritising types of green space provision • Play 89% • Formal sports provision 78% • General green space improvements 72% • Recreational routes 56% • Wildlife habitat 56% • Improving physical access 56% • Woodland 39% • Improving cultural access 28% • Interpretation and learning 28% • Wider countryside management 22% • Management of coastal areas 17% • Authorities able to ring fence contributions for non-specific projects 41%
Authorities sometimes working in partnership with developers 81% (examples include: Town Code/Master Plan, pre-application meetings, design advice) Authorities promoting green space to developers 71% Authorities sometimes requiring developers to retain ownership 76% (examples include: non-agreement on design and function, areas not of public benefit, work below standard, inaccessible, high risk, commuted sum not agreed, general reluctance from LA) Authorities sometimes passing ownership to others 50% (examples include: housing associations, resident management groups, Town and Parish Councils, Wildlife Trusts) Authorities working in partnership with other organisations 86% (examples include: Town and Parish Councils, Clubs and Community Groups, funding agencies, Sustrans, AONB’s, Community Forests, Regeneration Companies, BTCV, private sector, Groundwork, Wildlife Trusts)
Some Issues: • Strategy Framework and Delivery • 43% in Local Development Framework, 14% sub-regional Green Infrastructure Strategy. 46% have a strategy, only 50% of these link spending of contributions to strategy. Information on strategy is hard to evaluate, strategies can be over prescriptive. • Sharing good practice and setting standards • 27% use national standards, 50% have local standards, 54% fund staff, 46% ring fence contributions. Specific South West issues such as nursing homes and holiday homes exemptions. • Working with Developers and other partnerships • 44% raise contributions from non residential, 67% have specific exemptions, 78% use commuted sums for maintenance ranging between 10 – 20 years. 86% work in partnership in raising funds and delivering green space. • Flexibility & creativity, standard & strategic approach
Next steps • Record today’s presentations and workshop outputs • Incorporate today’s outputs in project report and circulate • Identify priority actions, look to resource • Develop action plan from research project