Download
1 / 36
360 likes | 447 Views
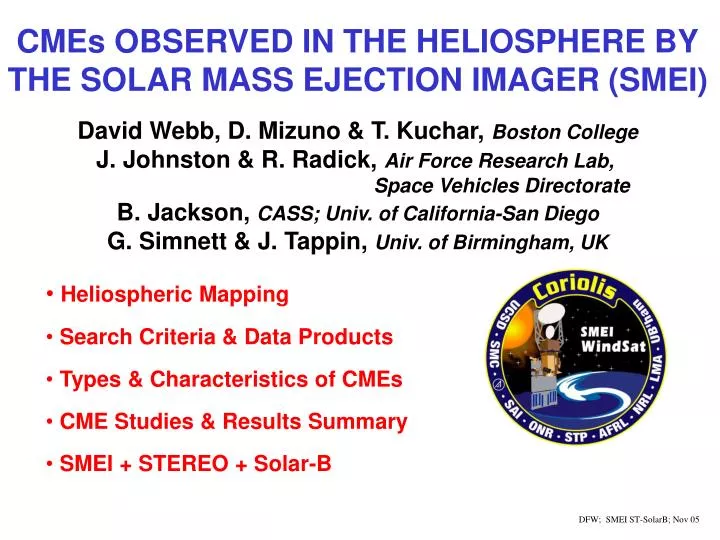
CMEs OBSERVED IN THE HELIOSPHERE BY THE SOLAR MASS EJECTION IMAGER (SMEI) David Webb, D. Mizuno & T. Kuchar, Boston College J. Johnston & R. Radick, Air Force Research Lab, Space Vehicles Directorate B. Jackson, CASS; Univ. of California-San Diego

E N D
CMEs OBSERVED IN THE HELIOSPHERE BY THE SOLAR MASS EJECTION IMAGER (SMEI) David Webb, D. Mizuno & T. Kuchar, Boston College J. Johnston & R. Radick, Air Force Research Lab, Space Vehicles Directorate B. Jackson, CASS; Univ. of California-San Diego G. Simnett & J. Tappin, Univ. of Birmingham, UK • Heliospheric Mapping • Search Criteria & Data Products • Types & Characteristics of CMEs • CME Studies & Results Summary • SMEI + STEREO + Solar-B
SMEI Fields of View Cam1 C1 C2 C3 Cam 3 Cam2
Frame Composite for Hammer-Aitoff Projection: the “Standard” SMEI View Cam 3 Cam 2 Cam 1 Every 30th camera frame during one orbit shown
Earth Orbit SMEI Aitoff View & LASCO Comparison Left: SMEI composite all-sky image with LASCO coronagraph field (blue) overlaid and CME superimposed. Top: SMEI and LASCO fields overlaid. Red arrows - Earth-directed CME. Blue arrows - obscured data from particle enhancements incl. SAA, auroral light, zone of exclusion and shuttered areas.
Search Criteria & Data Products: SMEI CMEs • Search uses near-real time processed Aitoff all-sky maps • - Orbital difference movies • Observation period searched: • - 6 February 2003 – end August 2004 • - Statistical study over first 1.5 years • - CME list being updated thru present • Data Products: • - Event files of images of each CME • - Movies of each CME • - File of comments for each CME • - Summary event list • Categories by Fractions of CMEs Observed by SMEI • A) Limb CMEs 50%? • B) Erupting prominences with CMEs >4% (>6) • C) Multiple CMEs 25% • D) Distant wide arcs ~30% • E) Concave-outward V-shaped CMEs 3% (4) • F) Earthward (“halo”) CMEs ~30%
(A) A Fast Limb CME 31 May 2003 Speed: LASCO C3: 1765 km/s SMEI: ~1450 km/s CCMC_2003
(B) An EPL/CME: Sun Surface to 35o Elongation February 2004 EIT 15, 00 – 10 LASCO C2 15, 05:30 SMEI Orbit diff. 16, 07 – 24 LASCO C3 15, 11:42
(C) Multiple CMEs & (D) Distant Arcs At least 4 separate CMEs! Slow, bright, bent arc to NW (Cam 3 into 2; lasts 2 days!) Faint, wide arc over NP 2 wide arcs to E & NW (NOT Halos! Cam 2 into 1)
E) Concave-outward CME Structures 25 April 2003 NNW of Sun 13 March 2003 NNE of Sun 26 July 2003 NW of Sun 28 May 2004 NNE of Sun Orbit-to-orbit difference images. Sun located at ‘+’ signs. Exclusion zone circle is 20o in radius.
(F) First Earth-Directed CME Seen by SMEI 28-29 May 2003 Tappin et al., GRL, 31, 2004
(F) SMEI Ecliptic “fisheye” Maps of Oct. 28-29, 2003 CME EIT 195A Oct. 28, 11:12 LASCO C2 Oct. 28, 11:30
Elongations Observed for CMEs First Observed Last Observed ~ 1/3 of SMEI CMEs can be tracked far from Sun.
Identifying Earthward CMEs in SMEI • Large Storms SMEI CMEs • Study of all intense storms (peak Dst < - 100nT), • Feb. 2003 - Jan. 2005; 2 years • - Of 21 storms, 3 inadequate SMEI obs., 1 not examined, 1 due • to shock sheath; • - Of 16 remaining, 87.5% (14/16) storms had assoc. SMEI CMEs. • All CMEs were at large elongations (> 60o) at storm onset. • All 16 storms had assoc. SMEI aurora. • - TIMINGS: • ΔT, 1 AU shock arrival - SMEI first obs. = 19.2 hr. (range 9-26 hr.) • ΔT, onset of storm - SMEI first obs. = 29.2 hr. (range 18-42 hr.) • Study of all moderate storms (peak Dst < - 60nT), • Mar. 2003 – Feb. 2005; 2 years • - For 85% (39 of 46) SMEI saw a CME within 2 days prior. • 1 AU Shocks SMEI CMEs • Study of 1 AU shocks; ACE, WIND (in-situ) & LASCO (CMEs) • 1998 - present • - Nearly all 1 AU shocks are assoc. with CMEs. • 20 shocks assoc. with SMEI CMEs (13 also with storms). • But these CMEs not atypical; e.g., elongation, spans.
SMEI - LASCO Comparisons • Preliminary SMEI LASCO Comparison Study • - Simnett study: February – December 2003 • - 71% (57/80) of SMEI CMEs associated with obvious LASCO CMEs. • - 14% (11/80) associated with very faint LASCO CMEs. • - The remaining 15% (12/80) have no associated LASCO event. • Complete LASCO ↔SMEI Comparison Study • - Underway: 3-year NASA grant; SMEI Team with NRL • - SMEI sees fewer CMEs than LASCO over same period. Why? • Because of operational down time for tests and calibrations. • Partial spatial obscurations; particles, aurora, sunlight. • Some CMEs seen in LASCO close to the Sun fade with height. • Sequences of events in LASCO manifest as a single feature in SMEI.
Statistical Results Summary: SMEI CMEs • SMEI has observed 139 CMEs in 1.5 years and 204 CMEs in 2.5 yr. • Est. occurrence rate = 0.31 CMEs/day • Brightness: Mean = 1.25 adu; 2.3 S10 units (range = 0.4 - 11 S10) • (based on preliminary calibration: 1 S10 = 0.55 adu) • Helios-2*: Mean = 2.3 S10 (1.5 - 2.95; 1976-1979) • Spans (detected): Mean > 42o; Range = 3 – 107o • LASCO*: Mean = 60o (median = 42o) • Helios-2*: Mean = 53o (1976-1979) • Durations: Mean 15.6 hr.; Range = 3 – 72 hr. • Helios-2*: Mean = 37 hrs. (1976-1979) • Speeds: Angular mean = 1.1o/hr. P-approx. mean = 482 km/sec • LASCO*: Mean = 507 km/sec • Helios-2*: Mean = ~500 km/sec (1976-1979) • SMEI detected ~20 halo CMEs at ~1/3 of Sun to Earth distance. • Can detect CMEs 10 hr. to 1+ days before Earth arrival. • * LASCO results courtesy S. Yashiro & N. Gopalswamy; • Helios-2 results from Webb & Jackson, JGR, 95, 1990.
SMEI Information Sources • References: • Instrument paper: Eyles et al., Solar Phys., 217, 319, 2003 • “Mission” paper: Jackson et al., Solar Phys., 225, 177, 2004 • URL for SMEI instrument description & general • information: • http://www.vs.afrl.af.mil/ProductLines/SMEI/ • URL for SMEI images & movies: • http://smei.nso.edu/
Possible SMEI-STEREO-Solar-B Joint Science • Overlap of the Missions • SMEI launched on STP Coriolis mission Jan 2003 • STEREO launch May/June 2006; Solar-B launch Sept. 2006 • SMEI nominal mission 3 years; 5 year design lifetime • Main degradation: Sunward camera signal-to-noise • - Uploading bad-pixel mask • Continuing operations ($2M/year) depend on: • - Success of Navy Windsat experiment • - AFRL finding support if Windsat fails Space Weather • Onset & source structure; Solar-B provides B-field • Different views of Earthward CME: SMEI - Head-on; STEREO HIs - Side-on • HIs: 3-D images early in mission; Triangulation later • Determine trajectory, time of arrival & strength of CME. • But CME rate low: CME rate at solar minimum 0.5-1/day SMEI Provides Context of Heliospheric Structures Movies of corotating structures & CMEs (3D recontructions) Time-of arrival of structures at STEREOs - Intercomparison of remote sensing & in-situ meas. - Tests of heliospheric models
3-Point Measurements of Large-Scale Structures SMEI + near-Earth/L1spacecraft + 2 STEREOs - In-situ measurements of plasma & IMF: L1 + STEREO in-situ - Density/Mass measurements from SMEI + STEREO HIs Comparison with Solar-B & COR1, COR2 measurements
SMEI CME Studies & Collaborations • Improved calibrations & reprocessing of existing data. • 3D reconstruction of IP density enhancements (CMEs • & corotating structures) and kinematics • Some collaborations with other data sets: • - LASCO comparison • - Ulysses on CME kinematics • - ICMEs & Forbush decreases • - IPS comparison • - Wind/WAVES • - SOHO SWAN (St. Cyr) • Space Weather modeling: HAF & other IP model • comparisons.
SMEI Presentations/Papers • Published • “Instrument” paper Eyles et al., Solar Phys., 2003 • May 2003 Halo CME – storm Tappin et al., GRL, 2004 • “Mission” paper Jackson et al., Solar Phys., 2004 • Oct-Nov 2003 period Webb & Allen, Space Weather, 2004 • In-press • 3D reconstr. of Oct-Nov 03 events Jackson et al., JGR, 2005 • Wind/WAVES – SMEI CMEs Reiner et al., JGR, 2005 • Survey of Halo CMEs T. Howard et al. • CMEs & Ulysses kinematics Tappin, Solar Phys., 2005 • SMEI-IPS; Oct. 2003 Tokumaru et al., URSI, 2005 • In progress • First-year CME statistics Webb et al. • Space weather Fry et al.; Webb et al. • ICMEs & Forbush decreases Simnett, Kahler (ICRC) • Comparison SMEI & IPS data Jackson, Tokumaru • Comet tail disconections Kuchar et al. • >40 talks/abstracts • 2 AGU Special Sessions • 16 popular articles or press releases
Some Speculation • CME Morphology: • More structured nearer Sun (Cam 3): • - True limb CMEs show more structure • - So do CMEs with erupting prominences • Broad arcs far from Sun (Cams 2 & 1): • -Shock or shock sheath? • - Compressed leading edge of ejecta? • Distant concave-outward structures: • - Evolved prominence material? • CME front encountering gradient in • solar wind flows? C2 C3 • SMEI vs LASCO: ~half of SMEI CMEs likely assoc. with LASCO CMEs. Detailed comparison to come. • - But many LASCO CMEs fade < 10Rs! • Why? Density decrease, turbulence, merge with solar wind, propagation direction, other??
3-D Reconstruction of CMEs Using SMEI UCSD Editing Sequencesfor SMEI Determine an Analytical Zodiacal Light Model Best Fit from a Minimum in Elongation – Position Angle Coordinates Folded into Four Quadrants. Residuals Minimized to Give Best Fit Model. SMEI Zodiacal cloud Subtraction from a model fit. How to determine the zodiacal cloud. Remove the Best Fit Analytic Zodiacal Model from a Sidereal Map to Determine the Stellar Background. How to remove it. Remove the Sidereal Stellar Background from the Original Data to Determine the True Zodiacal Light Using the Minimum in Elo. – P.A. for an Average of only a Few Orbits and to Check the Zodiacal Light Model Against the True Values Of Zodiacal Light.
3-D Reconstruction of CMEs Using SMEI UCSD Editing Sequence Zodiacal light and Removal
3-D Reconstruction of CMEs Using SMEI UCSD Editing Sequence Dealing with time series precisely. (Where stars brighter than 6th magnitude aren’t.) Late October, period ~1100 locations shown.
3-D Reconstruction of CMEs Using SMEI UCSD Editing Sequences Aurora Removal Aurora recognition and removal. How to know where the aurora is. How to remove it. Aurora Removed by Recognition of their Signal on an Orbit – Temporal Sequence Map.
3-D Reconstruction of CMEs Using SMEI Enhanced Images from Timeseries 26 May – 05 June 2003, (May 28 ‘Halo’ CME)
3-D Reconstruction of CMEs Using SMEI Enhanced Images from Timeseries Comparison with HAF model
3-D Reconstruction of CMEs Using SMEI SMEI 3D recon-struction of the 28 May CME. Electrons are contoured with an R-2 density fall- off between 10 - 30 e-cm-3.
3-D Reconstruction of CMEs Using SMEI Northeast-directed ejecta consistent with IPS g-level observations (Tokumaru et al., 2004) Southward ejecta C2 image LASCO C2 CME image to 6 Rs. Southward ejecta SMEI enhanced Sky Map image and animation to 110º elongation.
3-D Reconstruction of CMEs Using SMEI Mass determination ~6.7 1016g excess and 8.3 1016g total for northward directed structure within the 10 e-cm-3 contour. SMEI 3D recon-struction of the October 28 CME. The above structure has a mass of about 0.5 1016g excess in the sky plane but ~ 2.0 1016g excess at 60º (Vourlidas, private communication, 2004).
3-D Reconstruction of CMEs Using SMEI SMEI 3D reconstruction of the October 28, 2003 CME. The dominant structure vanishes about 45 from the Sun-Earth line. The arch-shaped structure fades to the south of Earth.
3-D Reconstruction of CMEs Using SMEI SMEI 3D recon-struction of the October 28 CME. Mass determination ~3.6 1016g excess and 4.2 1016g total within 20 e-cm-3 contour. The above structure has a mass of about 1.5 1016g excess in the sky plane.
3-D Reconstruction of CMEs Using SMEI SMEI reconstructed density on October 30 at 03 UT 15 e- cm-3 to 30 e- cc-3. IPS UCSD reconstructed velocity at 03 UT viewed above 1300 km s-1.
3-D Reconstruction of CMEs Using SMEI Summary/Work Needed: a) Modeling: Better heliospheric modeling - incorporation of 3D MHD into the forward- modeling tomographic analysis (Odstrcil et al.). b) Comparisons with STELab IPS results (Tokumaru et al.) & HAF model (Frye et al.) c) NRT Pipeline Processing of fully calibrated images d) Restrospective SMEI - 3D reconstruction analysis from the entire time period observed by SMEI and comparison with other CMEs.