Download
1 / 24
240 likes | 452 Views
Chapter 20a. Integrative Physiology II: Fluid and Electrolyte Balance. About this Chapter. Fluid and electrolyte homeostasis Water balance Sodium balance and ECF volume Potassium balance Behavioral mechanism in salt and water balance Integrated control of volume and osmolarity

E N D
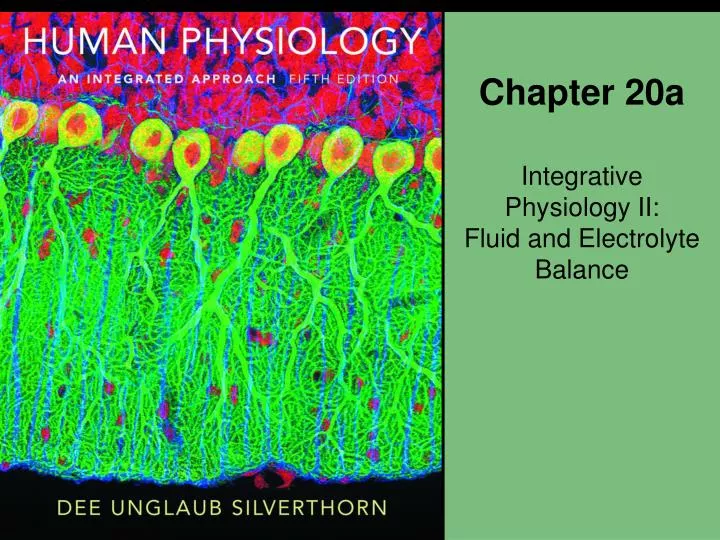
Chapter 20a Integrative Physiology II: Fluid and Electrolyte Balance
About this Chapter • Fluid and electrolyte homeostasis • Water balance • Sodium balance and ECF volume • Potassium balance • Behavioral mechanism in salt and water balance • Integrated control of volume and osmolarity • Acid-base balance
Blood volume Blood pressure Volume receptors in atria andcarotid and aortic baroreceptors trigger homeostatic reflexes Cardiovascularsystem Behavior Kidneys Cardiac output,vasoconstriction Thirst causeswater intake ECF and ICFvolume KEY Stimulus Receptor Effector Conserve H2Oto minimizefurther volumeloss Tissue response Bloodpressure Systemic response (a) Fluid and Electrolyte Homeostasis • The body’s integrated responses to changes in blood volume and blood pressure Figure 20-1a
Fluid and Electrolyte Homeostasis Blood volume Blood pressure Volume receptors in atria,endocrine cells in atria, and carotid and aortic baroreceptors trigger homeostatic reflexes Cardiovascularsystem Kidneys Cardiac output,vasodilation Excrete saltsand H2O in urine ECF and ICFvolume KEY Stimulus Receptor Effector Tissue response Bloodpressure Systemic response (b) Figure 20-1b
Water Balance Water gain Water loss Food and drink 2.2 L/day Insensiblewater loss0.9 L/day Skin Lungs 1.5 L/day Urine Metabolism 0.3 L/day 0.1 L/day Feces 2.5 L/day Totals 2.5 L/day Intake 2.2 L/day Metabolic production0.3 L/day Output2.5 L/day + – = 0 Figure 20-2
Water Balance • The kidneys conserve volume but cannot replace lost volume Volume gain Volume loss GFR canbe adjusted. Glomerularfiltration rate(GFR) Ifvolumefallstoo low,GFRstops. Body fluidvolume Kidneysrecyclefluid. Kidneysconservevolume. Volumeloss inthe urine Regulated H2Oreabsorption Figure 20-3
Distaltubule Proximaltubule 1 Isosmotic fluid leaving theproximal tubule becomesprogressively more concentratedin the descending limb. 300 mOsM CORTEX 300 100 300 mOsM MEDULLA Removal of solute in the thickascending limb createshyposmotic fluid. 2 1 3 Permeability towater and solutesis regulated byhormones. 2 Ionsreabsorbedbut nowater 3 600 mOsM Hormones control distal nephronpermeability to water and solutes. Only waterreabsorbed Urine osmolarity depends onreabsorption in the collectingduct. 4 Variable reabsorptionof water and solutes 900 mOsM LoopofHenle Collectingduct 1200 1200 mOsM 4 50–1200 mOsMurine excreted Urine Concentration • Osmolarity changes as filtrate flows through the nephron Figure 20-4
Urine Concentration Distaltubule Proximaltubule 1 Isosmotic fluid leaving theproximal tubule becomesprogressively more concentratedin the descending limb. 300 mOsM CORTEX 300 100 300 mOsM MEDULLA 1 Permeability towater and solutesis regulated byhormones. Ionsreabsorbedbut nowater 600 mOsM Only waterreabsorbed Variable reabsorptionof water and solutes 900 mOsM LoopofHenle Collectingduct 1200 1200 mOsM 50–1200 mOsMurine excreted Figure 20-4, step 1
Water Reabsorption • Vasopressin makes the collecting duct permeable to water Figure 20-5a
Water Reabsorption Figure 20-5b
Water Reabsorption • Vasopressin causes insertion of water pores into the apical membrane Cross section ofkidney tubule Medullaryinterstitialfluid Vasarecta Collectingductlumen Collecting duct cell 1 Vasopressin binds tomembrane receptor. Filtrate300 mOsM 600 mOsM H2O 600 mOsM 2 Receptor activates cAMPsecond messenger system. H2O H2O H2O 700 mOsM 4 Storage vesicles 3 Cell inserts AQP2 waterpores into apical membrane. Secondmessengersignal 2 Exocytosisof vesicles 1 4 Water is absorbed byosmosis into the blood. Vasopressin Aquaporin-2water pores cAMP 3 Vasopressin receptor Figure 20-6
Water Reabsorption Cross section ofkidney tubule Medullaryinterstitialfluid Vasarecta Collectingductlumen Collecting duct cell 1 Vasopressin binds tomembrane receptor. Filtrate300 mOsM 600 mOsM H2O 600 mOsM 2 Receptor activates cAMPsecond messenger system. H2O H2O H2O 700 mOsM 4 Storage vesicles 3 Cell inserts AQP2 waterpores into apical membrane. Secondmessengersignal 2 Exocytosisof vesicles 1 4 Water is absorbed byosmosis into the blood. Vasopressin Aquaporin-2water pores cAMP 3 Vasopressin receptor Figure 20-6, steps 1–4
Factors Affecting Vasopressin Release Figure 20-7
Water Balance • The effect of plasma osmolarity on vasopressin secretion by the posterior pituitary Figure 20-8
Countercurrent Heat Exchanger Warmblood Coldblood Warmblood Warmblood Heat lostto externalenvironment Limb (a) (b) Figure 20-9
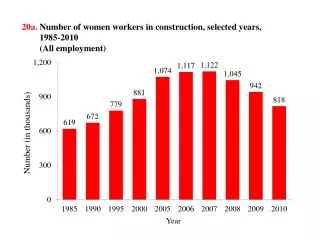
Water Balance Filtrate entering thedescending limb Blood in thevasa recta The ascending limb pumpsout Na+, K+, and Cl– • Countercurrent exchange in the medulla of the kidney 300mOsM 300mOsM 300mOsM 100mOsM 500 500 600 600 600 600 900 900 900 1200 Vasa recta 900 1200mOsM 1200mOsM KEY H2O = K+ = Loop of Henle Cl– = Na+ = (a) Figure 20-10a
100 mOsmleavingthe loop 4 3 Water cannotfollow solute 2 Saltreabsorption Interstitialfluid Cells of ascendingloop of Henle (b) 1200 mOsmenteringascendingloop of Henle 1 KEY K+ = H2O = Cl– = Na+ = Ion reabsorption • Active reabsorption of ions in the thick ascending limb creates a dilute filtrate in the lumen Figure 20-10b
Fluid and Electrolyte Balance • Vasa recta removes water • Close anatomical association of the loop of Henle and the vasa recta • Urea increases the osmolarity of the medullary interstitium
Sodium Balance • Homeostatic responses to salt ingestion Figure 20-11
Sodium Balance Interstitialfluid P cell of distal nephron Blood 1 Aldosterone combines witha cytoplasmic receptor. Lumenof distaltubule Hormone-receptor complexinitiates transcription inthe nucleus. 2 Aldosterone 1 2 3 Translation andprotein synthesis Aldosteronereceptor 3 New protein channels andpumps are made. Newchannels New pumps ATP 4 Proteins modulateexisting channels and pumps 4 Aldosterone-inducedproteins modify existingproteins. K+ secreted K+ 5 K+ K+ ATP Na+ reabsorbed Na+ Result is increased Na+reabsorption andK+ secretion. 5 Na+ Na+ Figure 20-12
Sodium Balance • The renin-angiotensin-aldosterone system (RAAS) constantlyproduces Angiotensinogenin the plasma Liver Granular cells(kidney) Bloodpressure produce Renin ANG I in plasma contains Blood vesselendothelium ACE(enzyme) ANG II inplasma Adrenal cortex Cardiovascularcontrol centerin medullaoblongata Arterioles Hypothalamus Aldosterone Cardiovascularresponse Thirst Na+ reabsorption Vasopressin Vasoconstrict Volumeand maintainosmolarity Bloodpressure Figure 20-13
Sodium Balance • Decreased blood pressure stimulates renin secretion Bloodpressure Cardio-vascularcontrolcenter GFR direct effect NaCltransport Sympatheticactivity across Macula densaof distal tubule Granular cells ofafferent arteriole Paracrines Reninsecretion Figure 20-14
Sodium Balance • Natriuretic peptides promote salt and water excretion Increasedblood volumecauses increasedatrial stretch Myocardialcellsstretch andrelease Natriuretic peptides Medullaoblongata Adrenalcortex Kidney Hypothalamus Lessvasopressin Decreasedblood pressure IncreasedGFR Decreasedrenin Less aldosterone NaCl andH2O excretion Figure 20-15


![S90-20A Exam Dumps - Get S90-20A Dumps PDF [2018]](https://cdn4.slideserve.com/7919558/arcitura-education-s90-20a-exam-certified-dt.jpg)