Download
1 / 32
330 likes | 487 Views
ROI GROCERY MARKET REVIEW. Data to 5th January 2014. OVERVIEW. Market Overview The market is seeing positive growth on an annual basis of +0.8% but the latest quarter has been more difficult with a -0.2% decline.

E N D
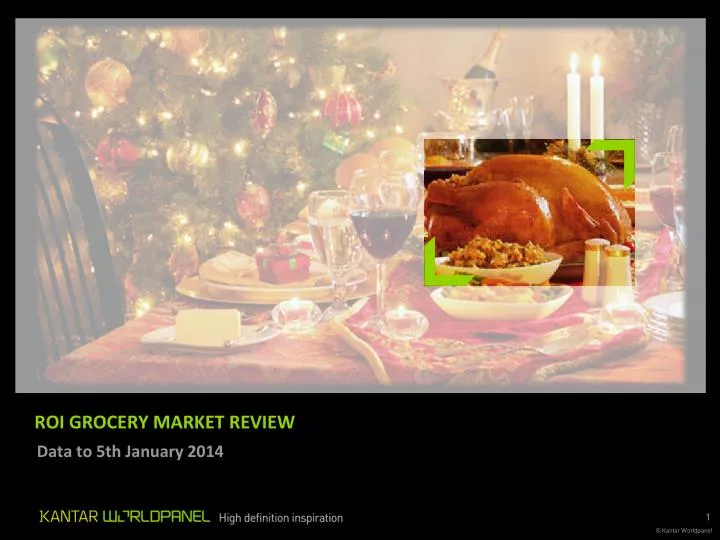
ROI GROCERY MARKET REVIEW Data to 5th January 2014
OVERVIEW • Market Overview • The market is seeing positive growth on an annual basis of +0.8% but the latest quarter has been more difficult with a -0.2% decline. • While there has been price inflation, shoppers continue to compensate for price increases by purchasing on offer and trading down to cheaper lines. However increased volume bought over the Christmas period together with price inflation has resulted in year on year household spend increasing by +0.7%. • Irish households are making more trips this period, with frequency up by +0.8%. • Spend per trip has remained steady, spend per household has increased. • Although the private label share of the grocery market slowed during the lead up to the Christmas period, it is still well ahead of last year.
Total Irish Grocery Market Value and Growth - 52 and 12 w/e Irish grocery market sales have grown over the 52 week period by 0.8%, but are down by 0.2% for the 12 week period +0.8% +1.4% +0.6% -0.2% 3
Total Irish Grocery Market Volume Sales and Growth - 52 and 12 w/e Growth of 1.3% in volume sales in the 12 week period Volume sales flat over the 52 week period 0.0% -0.2% +1.1% +1.3% 4
+1.3% +1.9% -3.3% +0.7% -3.1% +1.4% -7% Total Grocery - Sector Value Share & Growth 52w/e Fresh Food, Ambient Food and Toiletries driving growth in Grocery over the full year
Ambient Food 30% Fresh & Chilled Produce 47% Household 7% Frozen 5% Toiletries 4% Alcohol 7% Healthcare 1% Total Grocery - Sector Value Share & Growth 12w/e The decline in 12 week sales is coming from sales losses year on year in Healthcare, Frozen Food, Alcohol and Fresh & Chilled Food Share of total trolley Total Trolley -0.2% value 6
Analysis by Category – Growth/Decline? Decline in Frozen Meat, Frozen Poultry & Game, Healthcare and Fruit & Veg & Salad 12w Total Grocery - value % change by category 7
Large Majority of Markets Seeing Price Inflation, in particular Toiletries and Alcohol
Change in Inflation Rates and Household Spend 12 w/e Inflation for the Irish grocery market is just under 3% % change year on year – 12 week period 9
How are shoppers coping? Store choice Spend less Trade down Buy on deal
Trended View of Consumer Coping Strategies Trading down product or price tier still remains the key method of dealing with inflation while shoppers are back to buying more volume 11
Changes in Consumer Shopping Behaviour - 12w/e Shoppers are buying more often with frequency increasing by +0.8%. While spend per trip has remained steady, spend per Household has increased by €9. Average frequency increased by +0.8% Increase in 12w spend per HH (+0.7%) Average basket spend is at -0.1% 12
Share of Market - Branded, Private Label and No Brand Name While Branded share had seen some share growth in the run up to Christmas, branded sales are down compared to last year. 12w Total Grocery – value % 13
Private Label Value Share of Total Irish Grocery Market Private Label share of the grocery market slowed as we moved towards Christmas however still performed well ahead of last year 12w Total Grocery – Private Label value % 14
Branded and Private Label Inflation – 12w/e Inflation in Private Label goods beginning to drop back
Private Label % Value Share by Category Where is Private Label Strong? – Meats and staples are key for Private Label 12w Total Grocery -Categories where Private Label overtrade 16
Private Label % Value Share by Category Where is Private Label weaker? – Categories with multiple strong brands and toiletries perform well 12w Total Grocery - Categories where Private Label undertrade 17
Market Share and Growth by Branded and Private Label Tier Premium Private Label in growthwhile Value Private Label declines with shoppers most likely to trade up around Christmas % Value Share % Value Growth
Average price per pack (€) €3.09 Premium PL Shoppers trading up to Premium Private Label this period while Standard Private Label still gains from Branded €1.5m €2.61 Branded €203k €4.8m €503k €1.75 Standard PL Value PL €1.05
Total Grocery – % Packs Sold On Deal – 52 w/eShoppers perceive that the % of packs sold on deal is consistent over time
Total Grocery - Sold on Deal Trended 12 w/ePromotional activity still hovers around the 14% mark of grocery sales however promotional activity is higher than this time last year
Total Grocery - Sector Share Sold on Promotion – % Packs Promotional activity on Alcohol is behind what we saw last year
Bathroom Toiletries & Take Home Savouries Have the Highest % of Packs Sold On Deal, While Healthcare and Dairy Products Have the Lowest Percentages. 12w Total Grocery - pack % sold on deal by category 23
Total Cross Border Sales – Share of ROI Grocery Market – 52 w/eCross Border Sales continue to decline now making up just under 2% of sales (€173m) down 6% on last year.
Total Cross Border Sales – Share of Irish Grocery Market – 12 w/eCross border share declined over Christmas despite seeing an increase over the pervious periods. Cross Border Value % Share of ROI Grocery Market – 12w/e 26
Total Cross Border - % Penetration 16% of ROI shoppers have shopped across the border in the last 12 weeks
UK Grocery – Value SalesUK market showing growth year on year as inflation plays a part 52w/e UK Grocery Value sales +3.6%
Market Size Grocery Spend per HH Market Growth Price Inflation • €9b • €5,500 • 0.8% • 2.9% • £104b • stg£3,900 • +3.7% • +2.5% How do GB & Ireland grocery markets compare? Source: Kantar Worldpanel, data to 5th Jan 2014
Private Label % Market SharePrivate label rising in the UK up to 47.9%